Open Access
Fig. 3
Download original image
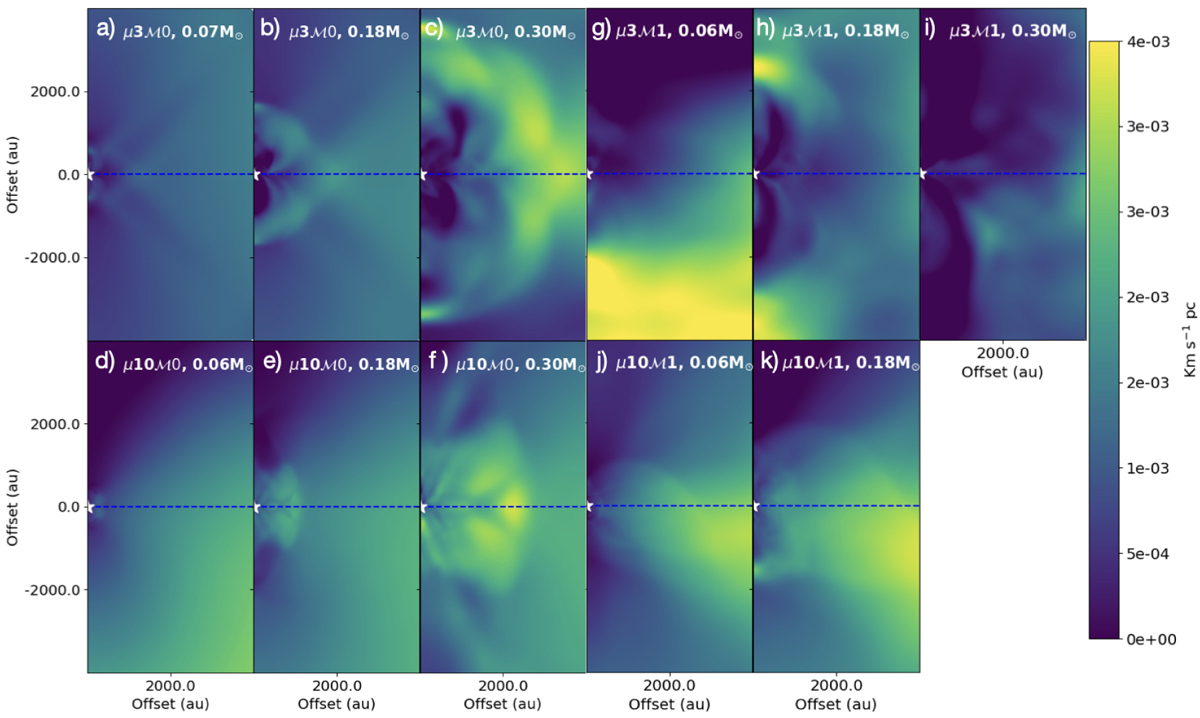
Maps of the azimuthally averaged SAM in the models, ![]() . The white star and dashed blue line depict the location of the protostar and the equatorial plane, respectively. The leftmost panels, from (a) to (f), show the nonturbulent models, while the rightmost panels, from (g) to (k), present the turbulent models’ outputs.
. The white star and dashed blue line depict the location of the protostar and the equatorial plane, respectively. The leftmost panels, from (a) to (f), show the nonturbulent models, while the rightmost panels, from (g) to (k), present the turbulent models’ outputs.
Current usage metrics show cumulative count of Article Views (full-text article views including HTML views, PDF and ePub downloads, according to the available data) and Abstracts Views on Vision4Press platform.
Data correspond to usage on the plateform after 2015. The current usage metrics is available 48-96 hours after online publication and is updated daily on week days.
Initial download of the metrics may take a while.