Open Access
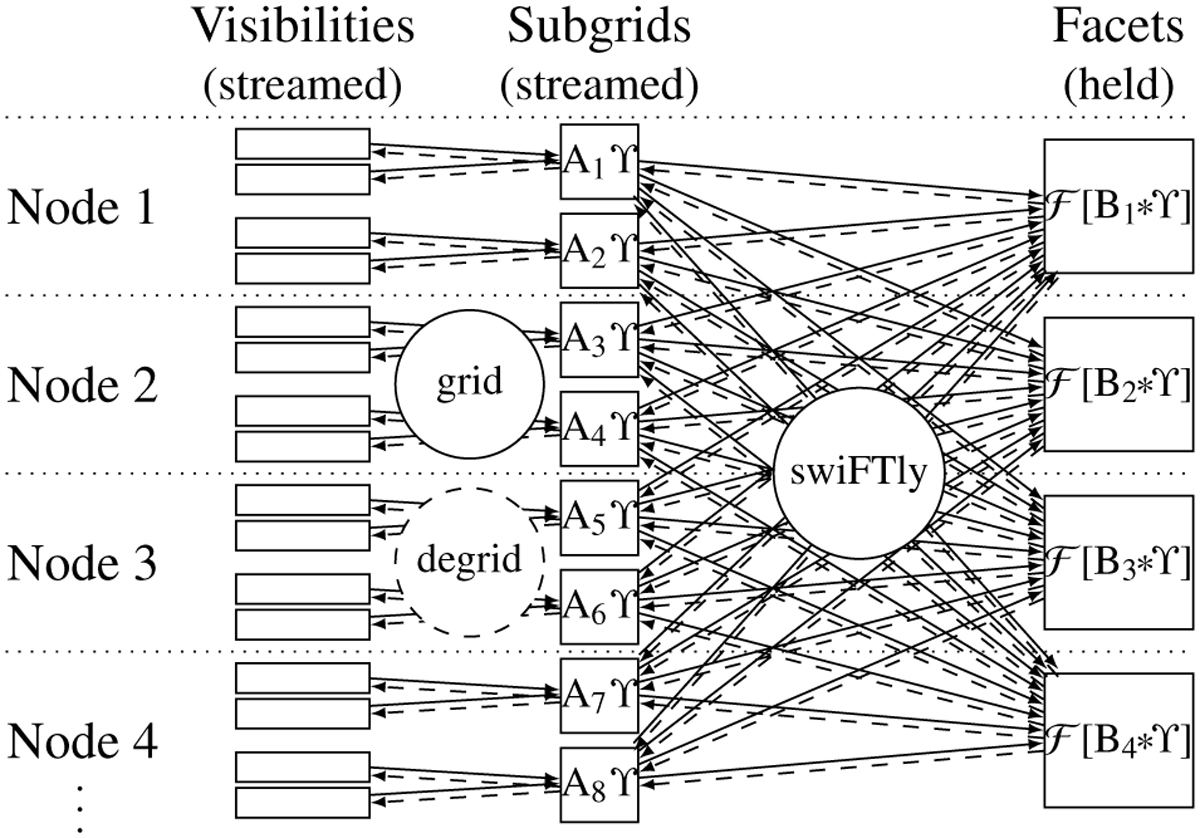
Fig. 1
Download original image
Distribution concept sketch of our algorithm. The visibilities are gridded to subgrids (solid lines), and the contributions are accumulated to facets. The dashed lines indicate the reverse direction: the contributions are extracted from the facets, and the visibilities are degridded from the subgrids.
Current usage metrics show cumulative count of Article Views (full-text article views including HTML views, PDF and ePub downloads, according to the available data) and Abstracts Views on Vision4Press platform.
Data correspond to usage on the plateform after 2015. The current usage metrics is available 48-96 hours after online publication and is updated daily on week days.
Initial download of the metrics may take a while.