Open Access
Fig. A.2.
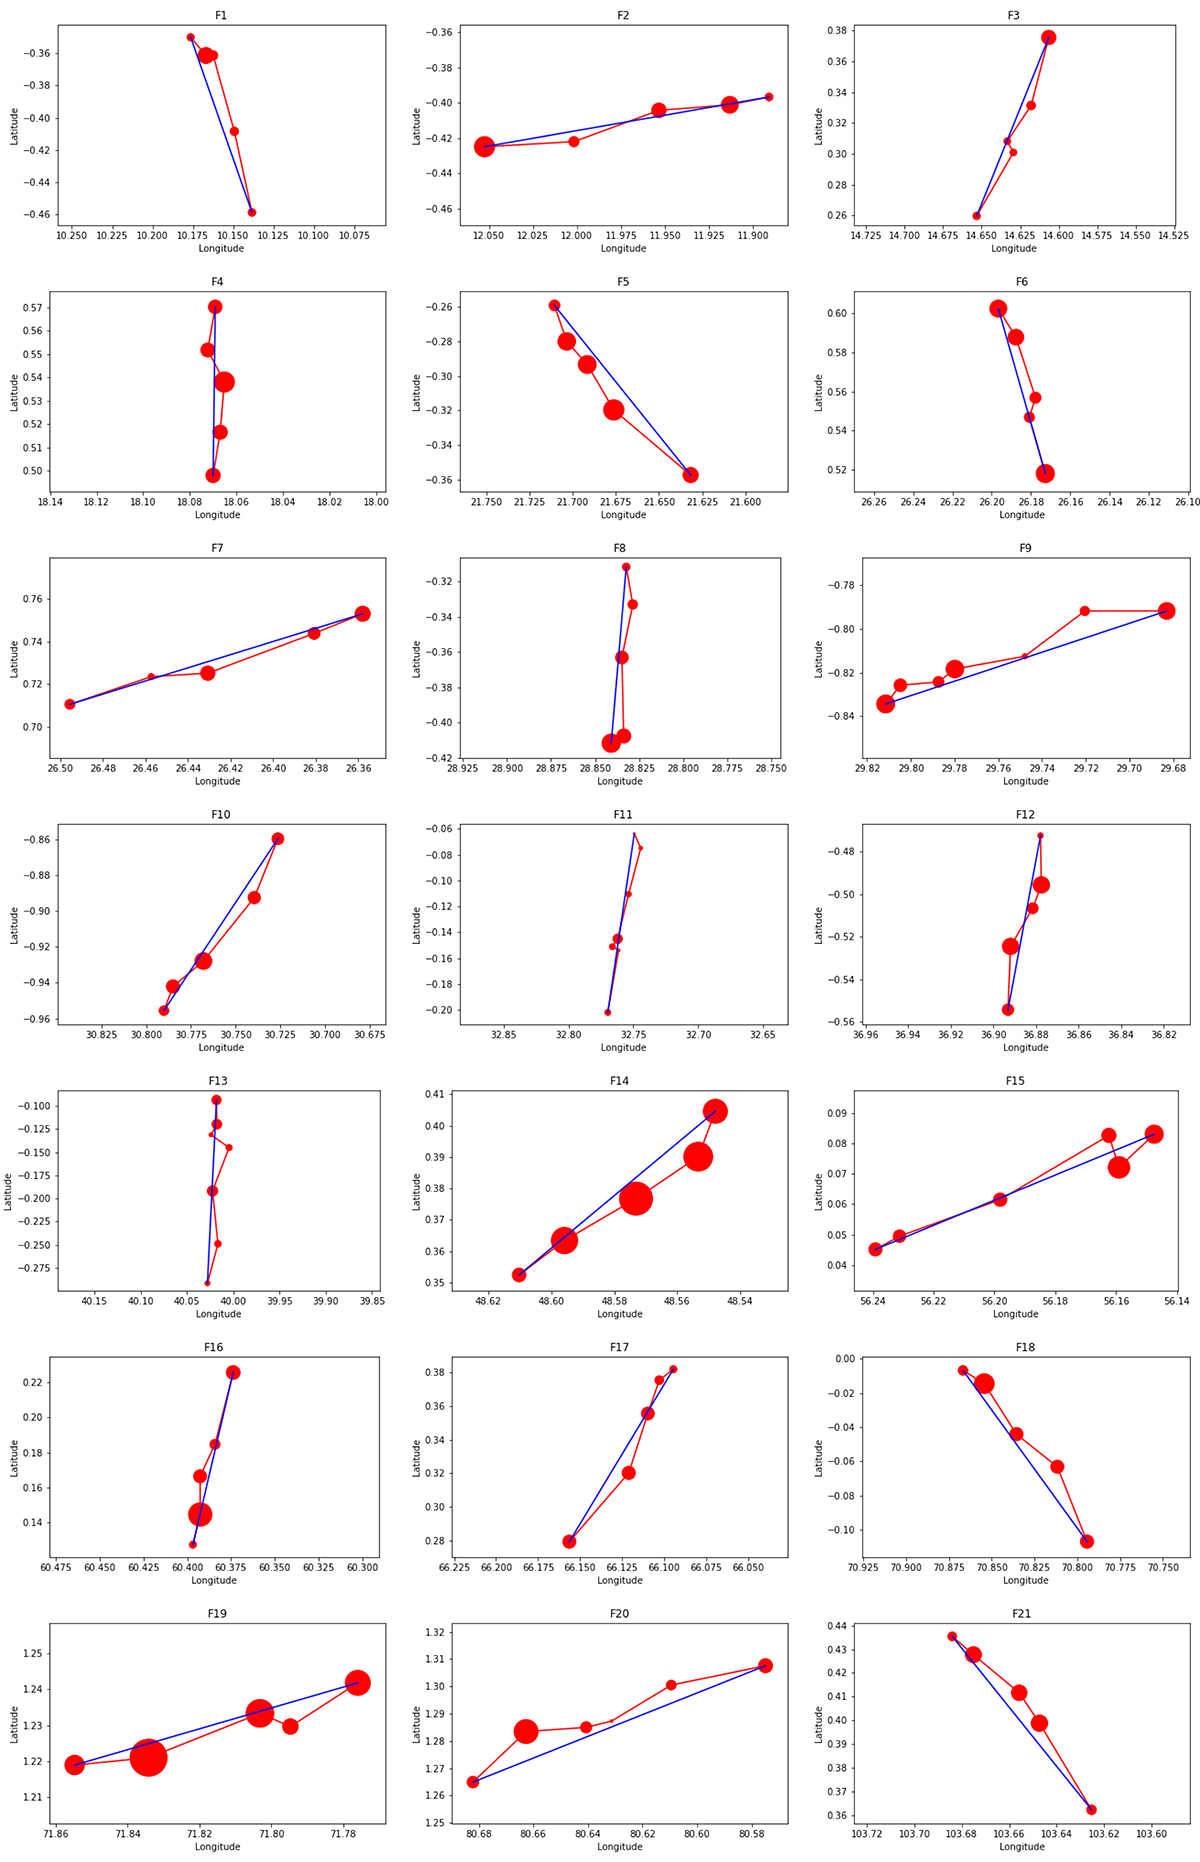
Download original image
MST for F1 to F21. The red circles represent the position and size of the Herschel/HiGAL clumps, and the red segments are the MST edges connecting the clumps. The blue line marks the filament end-to-end.
Current usage metrics show cumulative count of Article Views (full-text article views including HTML views, PDF and ePub downloads, according to the available data) and Abstracts Views on Vision4Press platform.
Data correspond to usage on the plateform after 2015. The current usage metrics is available 48-96 hours after online publication and is updated daily on week days.
Initial download of the metrics may take a while.