Fig. 2.
Download original image
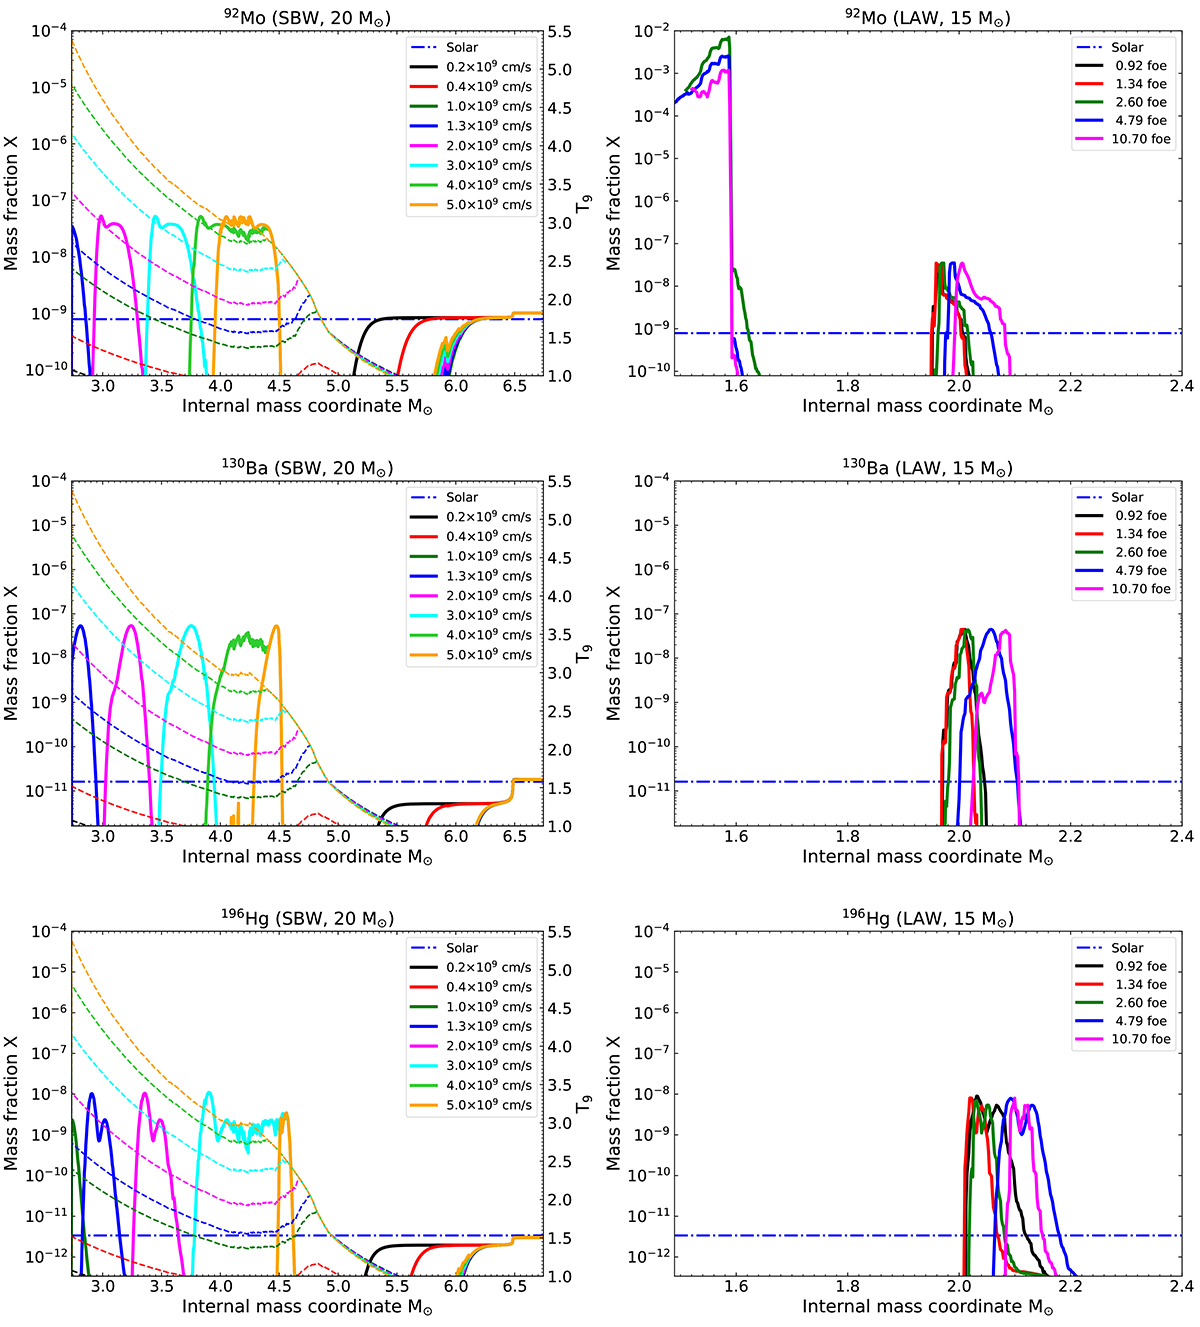
Effect of different explosion energies and prescriptions on three representative p-nuclei. Left panels: 92Mo (upper panel), 130Ba (central panel), and 196Hg (lower panel) abundances in mass fractions as a function of the internal mass coordinate (solid lines, left axis) and explosion peak temperature in T9 (dashed lines, right y-axis) in the 20 M⊙ SBW models. Different colors denote different shock velocities. Right panels: same as the left panels but for a sample of the 15 M⊙ LAW models, without the explosion peak temperature plotted. The horizontal dashed-dotted blue line in each panel represents the solar abundance of the representative isotope in mass fractions taken from Asplund et al. (2009).
Current usage metrics show cumulative count of Article Views (full-text article views including HTML views, PDF and ePub downloads, according to the available data) and Abstracts Views on Vision4Press platform.
Data correspond to usage on the plateform after 2015. The current usage metrics is available 48-96 hours after online publication and is updated daily on week days.
Initial download of the metrics may take a while.