Fig. 1.
Download original image
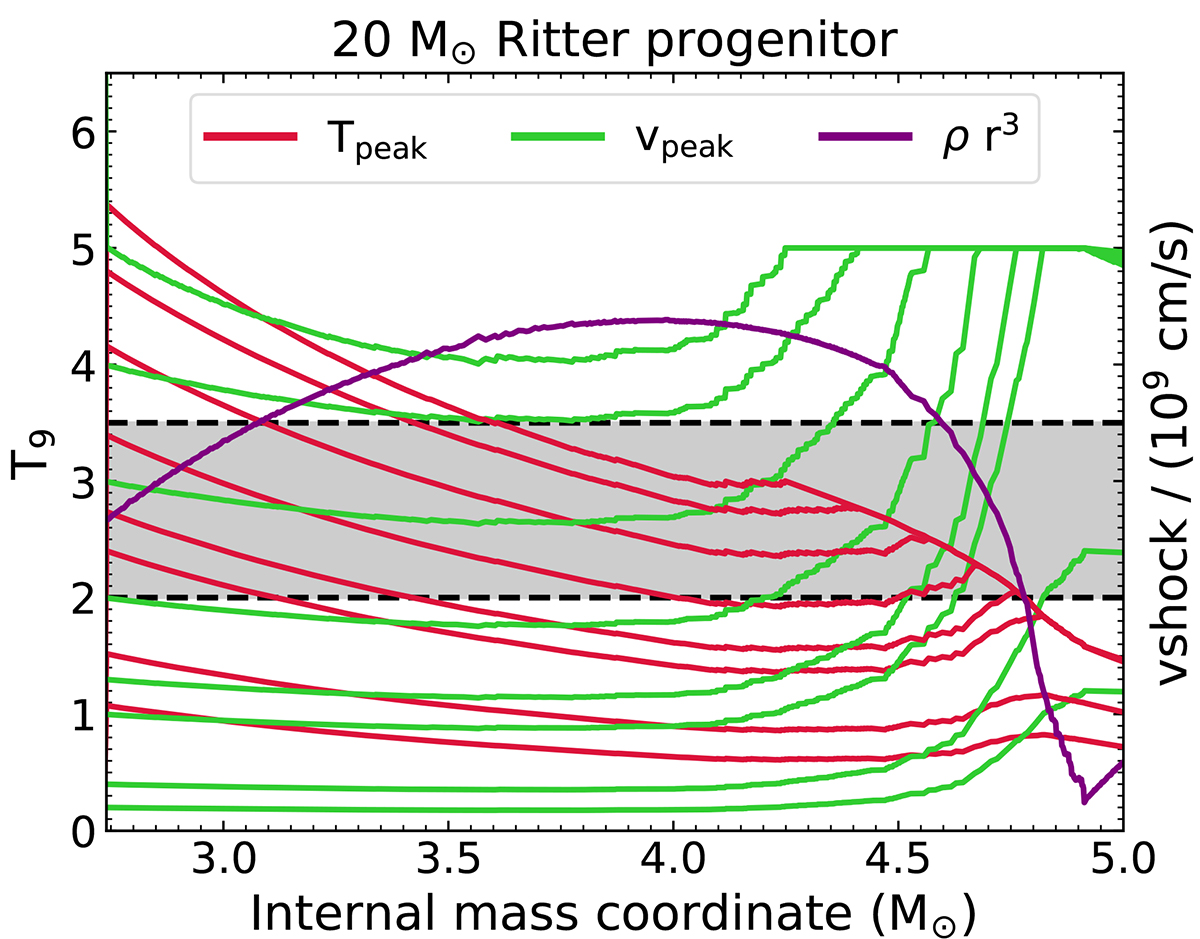
Peak shock temperature (solid red lines) and velocity (solid green lines) for different initial explosive conditions in the 20 M⊙ progenitor from Ritter et al. (2018b). The purple line represents the logarithm of the quantity ρr3 in the pre-supernova model in arbitrary units. The gray region represents the temperature range for the activation of the γ process, i.e., between 2 GK and 3.5 GK. Note that the saturation of the shock velocity at ∼4.2 M⊙ at the value of 5 × 109 cm s−1 is due to the artificial cap imposed for viscous forces (see Sect. 2.1).
Current usage metrics show cumulative count of Article Views (full-text article views including HTML views, PDF and ePub downloads, according to the available data) and Abstracts Views on Vision4Press platform.
Data correspond to usage on the plateform after 2015. The current usage metrics is available 48-96 hours after online publication and is updated daily on week days.
Initial download of the metrics may take a while.