Fig. 7.
Download original image
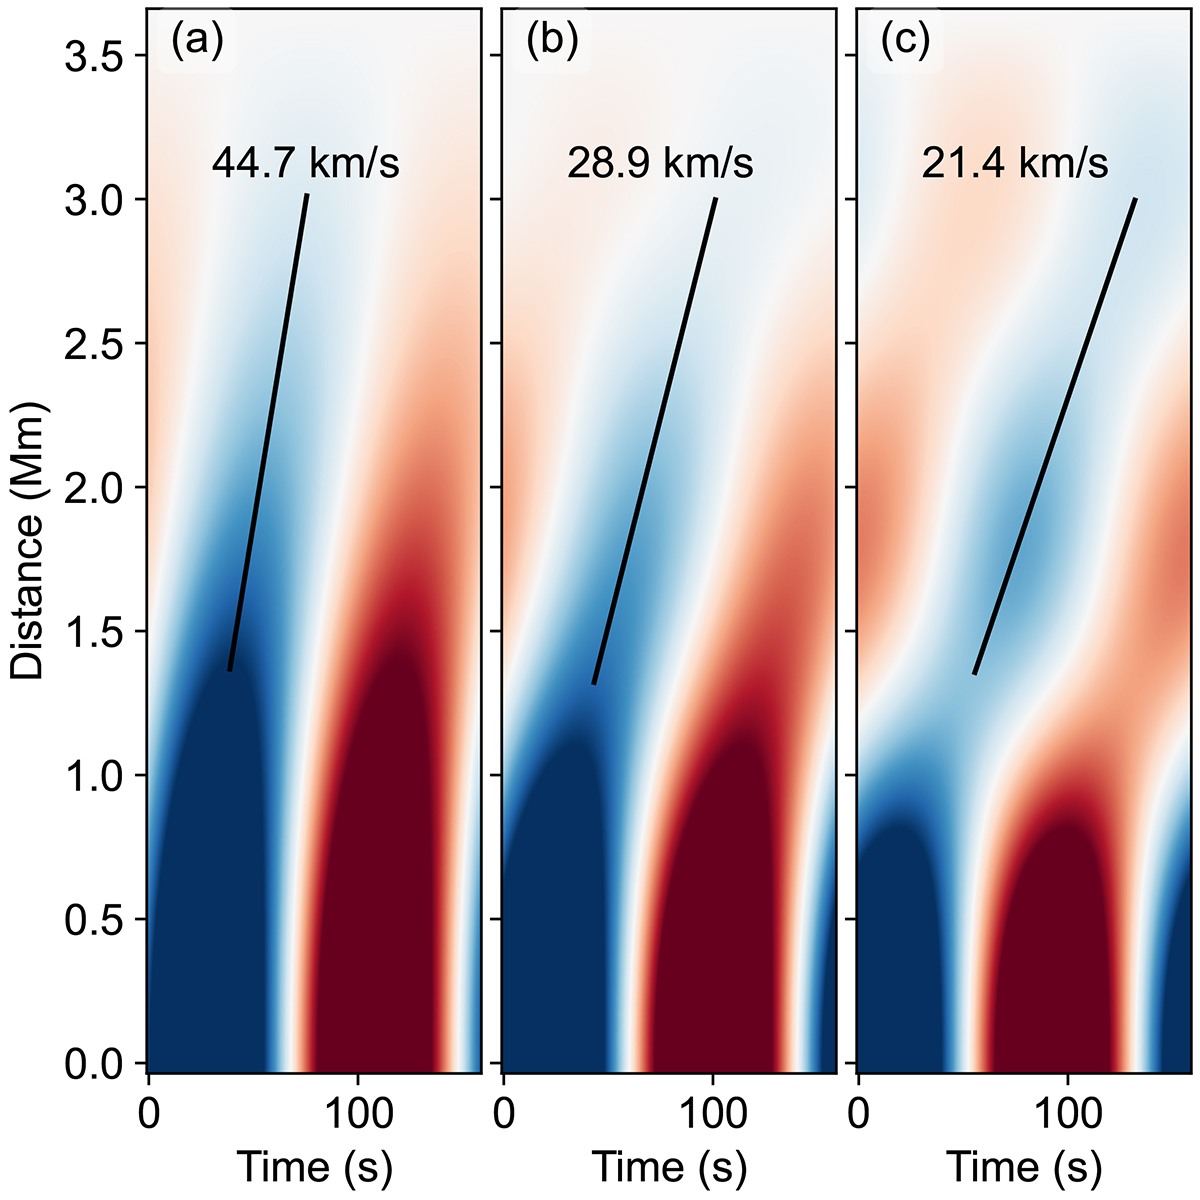
Time–distance map of modeled m = 0 mode waves for three different cases. (a) TD map with the amplitudes of A0, 1 = 2.25, A0, 2 = 2.0, and A0, 3 = 0.5 in units of km s−1. (b) TD map with the amplitudes of A0, 1 = 1.5, A0, 2 = 2.25 and A0, 3 = 1.5 in units of km s−1. (c) TD map with the amplitudes of A0, 1 = 0.5, A0, 2 = 2.0 and A0, 3 = 2.25 in units of km s−1. All of them have the phase differences of t0, 1 = 0, t0, 2 = −20 and t0, 3 = −40 in seconds. The solid lines represent the gradients of the ridges, and their values are shown in each panel.
Current usage metrics show cumulative count of Article Views (full-text article views including HTML views, PDF and ePub downloads, according to the available data) and Abstracts Views on Vision4Press platform.
Data correspond to usage on the plateform after 2015. The current usage metrics is available 48-96 hours after online publication and is updated daily on week days.
Initial download of the metrics may take a while.