Fig. 6.
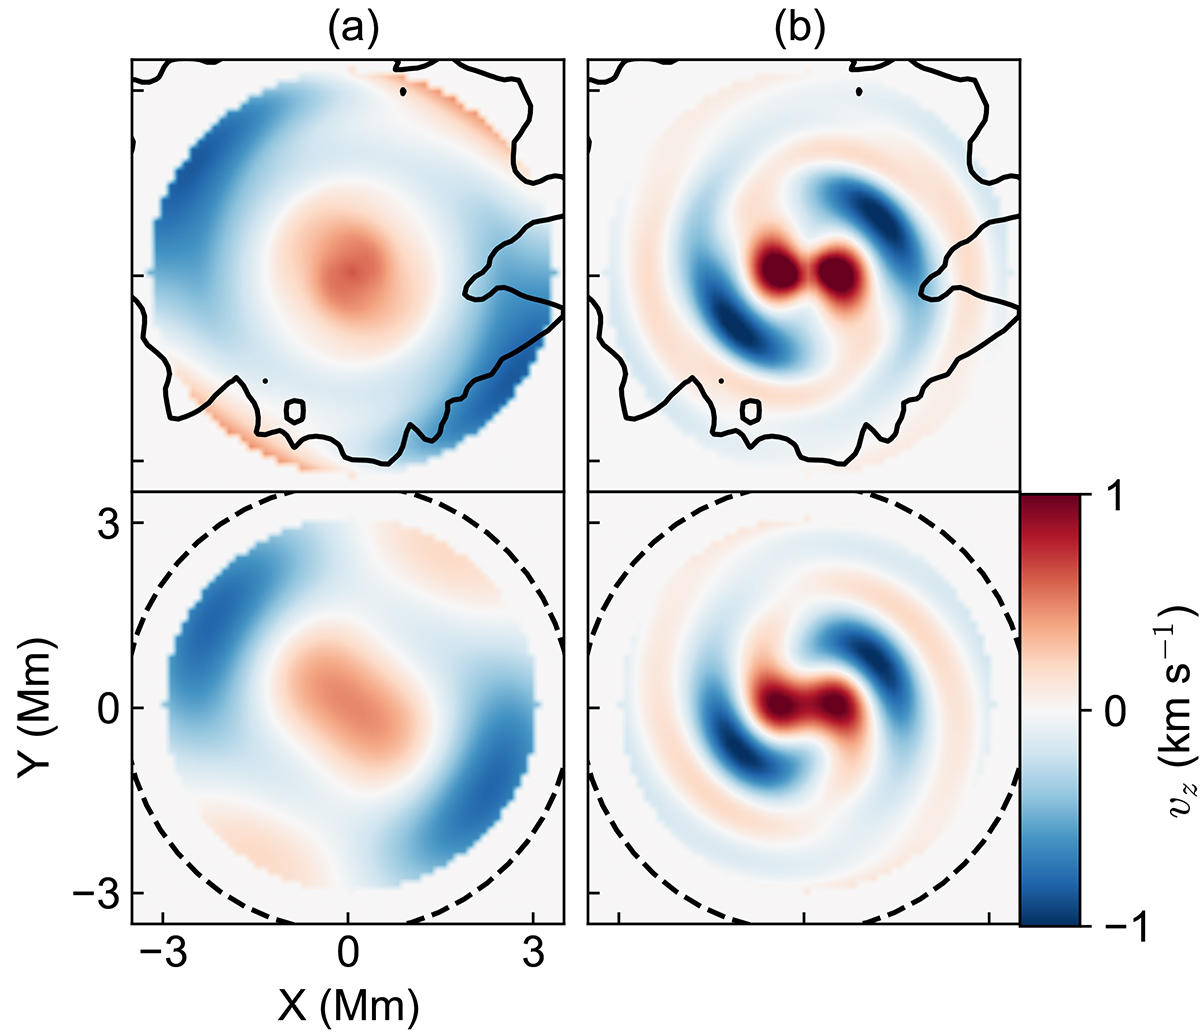
Download original image
Oscillation patterns in low and high-frequency bands. Top panels show the observed oscillation patterns at 17:44:07 UT, which are spatially filtered in m = 0 and 2 modes and temporally filtered in (a) 2.5 − 4 mHz and (b) in 12 − 20 mHz. Bottom panels show the model for each frequency band. The contour represents the boundary of the pore, and the dashed circle illustrates the boundary of the flux tube. All panels only show a 3 Mm radius from the center because the outer region is affected by the running penumbral waves and error.
Current usage metrics show cumulative count of Article Views (full-text article views including HTML views, PDF and ePub downloads, according to the available data) and Abstracts Views on Vision4Press platform.
Data correspond to usage on the plateform after 2015. The current usage metrics is available 48-96 hours after online publication and is updated daily on week days.
Initial download of the metrics may take a while.