Fig. 5.
Download original image
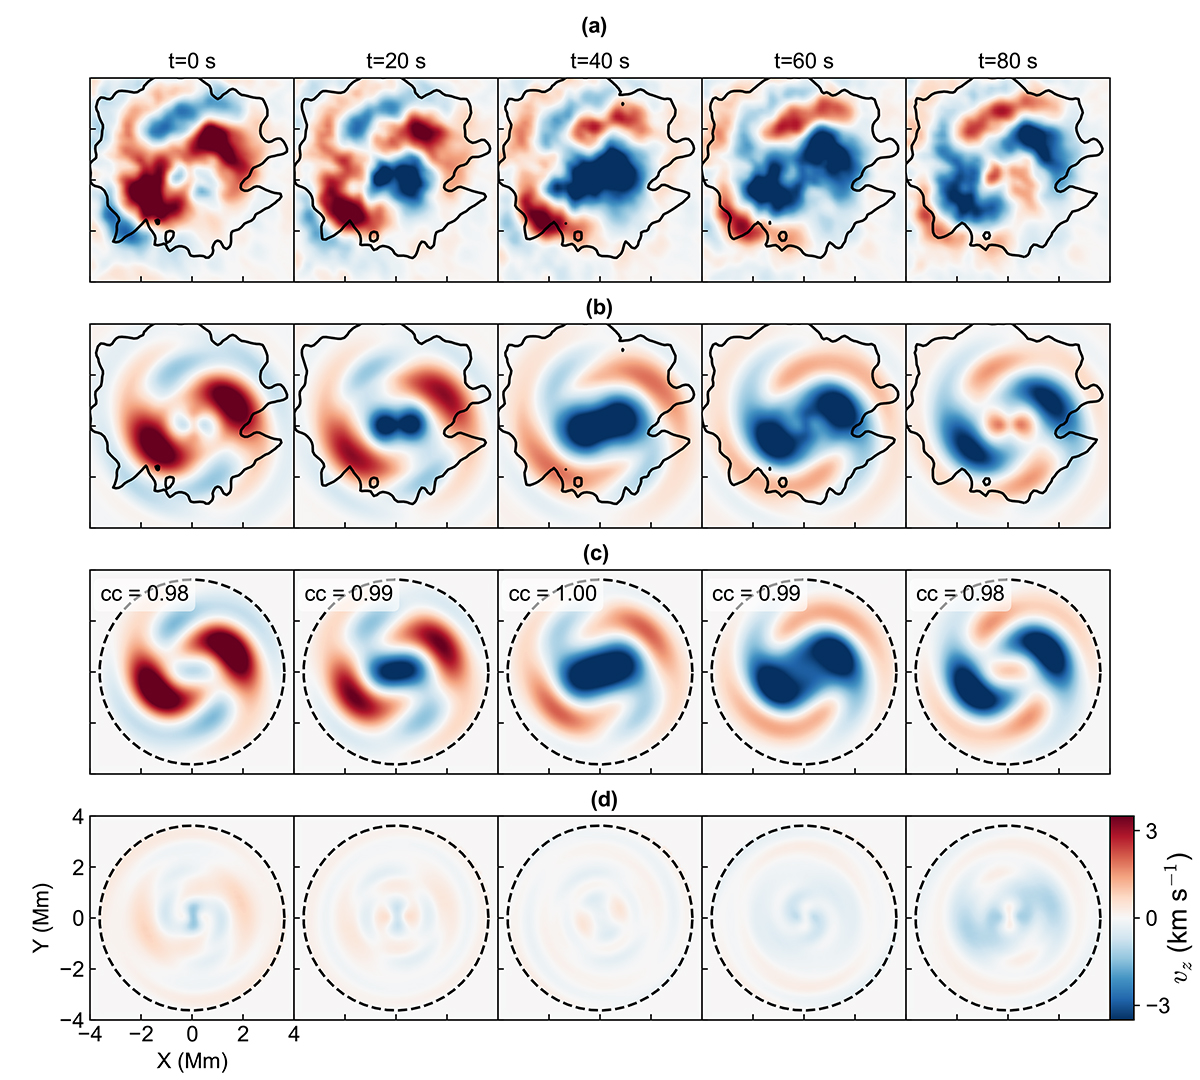
Temporal evolution of the spiral-shaped wave patterns. (a) Observed LOS velocity map temporally filtered in the frequency range of 5.5 − 9 mHz. (b) LOS velocity map additionally filtered in the azimuthal mode of m = 0, and 2. (c) Modeled velocity map constructed by the superposition of a total of 12 modes; m = 0, ±2, and n = 1, 2, 3, 4. (d) Residual between the filtered map (b) and the model (c). The model parameters are shown in Table 1. Columns show the temporal evolution of each map from t = 0 to t = 80 s. Here, the time t = 0 s is equal to 17:43:27 UT, which is the middle time of the wave packet shown in Fig. 4. The black solid contour indicates the boundary of the pore, and the black dashed circle represents the boundary of the flux tube of the model. The correlation values between (b) and (c) are shown in the top corner of each panel of (c).
Current usage metrics show cumulative count of Article Views (full-text article views including HTML views, PDF and ePub downloads, according to the available data) and Abstracts Views on Vision4Press platform.
Data correspond to usage on the plateform after 2015. The current usage metrics is available 48-96 hours after online publication and is updated daily on week days.
Initial download of the metrics may take a while.