Fig. 4.
Download original image
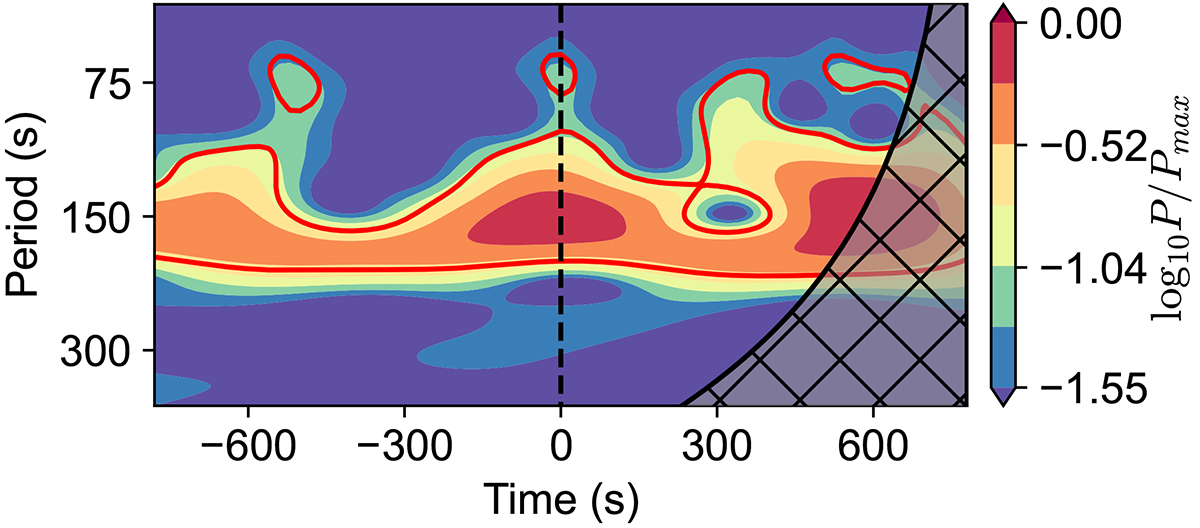
Wavelet power spectrum of the Doppler velocity averaged over 3 × 3 pixels at the center of the oscillation patterns. The black dashed line represents the time t = 0 at 17:43:27 UT, which is the middle time of the wave packet of spiral-shaped wave patterns. The red contour indicates the 95% confidence level, and the hashed region shows the cone of influence. Among the total observing duration (of −3200 s to 780 s), the diagram shows only the time range of −780 s to 780 s.
Current usage metrics show cumulative count of Article Views (full-text article views including HTML views, PDF and ePub downloads, according to the available data) and Abstracts Views on Vision4Press platform.
Data correspond to usage on the plateform after 2015. The current usage metrics is available 48-96 hours after online publication and is updated daily on week days.
Initial download of the metrics may take a while.