Fig. 3.
Download original image
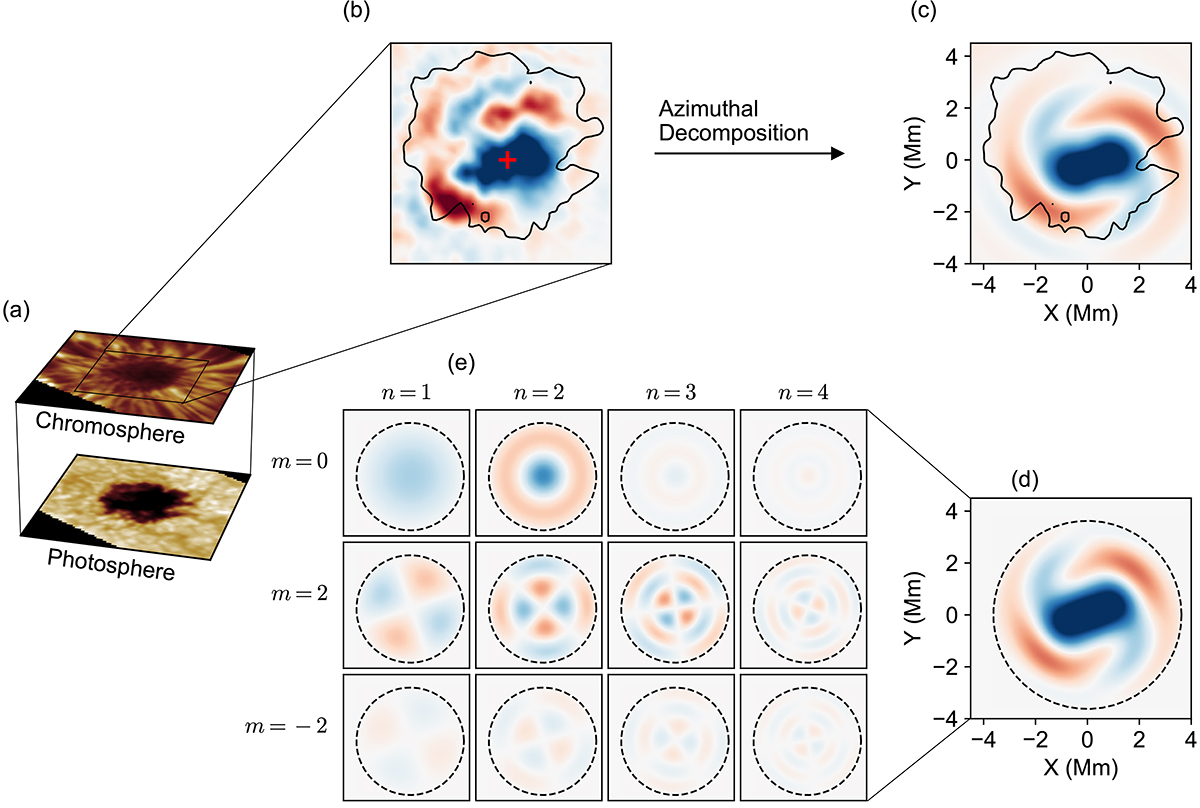
Detection of a pattern of umbral oscillations. (a) Continuum intensity map of the GST/FISS constructed at the −43.5 Å of the Hα line center and chromospheric intensity map constructed at the line center at 17:44:07 UT on June 3, 2014. (b) Two-dimensional wave patterns of the chromospheric Doppler velocity map temporally filtered in 5.5 − 9 mHz. The black contour displays the boundary of the pore, and the red cross symbol marks the center position of the SWP. (c) Azimuthally decomposed wave patterns for m = 0 and ±2 modes. (d) Modeled LOS velocity fluctuation map constructed by the superposition of 12 modes (m × n, where m = 0, 2, −2 and n = 1, 2, 3, 4). The dashed circle shows the boundary of the modeled flux tube. (e) All modes of trapped fast-body waves for the modeled LOS velocity map. Here m represents the azimuthal mode and n refers to the radial mode. The color limit of panels b–e is −3.5 to 3.5 km s−1, where the positive sign signifies the redshift. The temporal evolutions of panels b–d are shown in Fig. 5.
Current usage metrics show cumulative count of Article Views (full-text article views including HTML views, PDF and ePub downloads, according to the available data) and Abstracts Views on Vision4Press platform.
Data correspond to usage on the plateform after 2015. The current usage metrics is available 48-96 hours after online publication and is updated daily on week days.
Initial download of the metrics may take a while.