Fig. 1.
Download original image
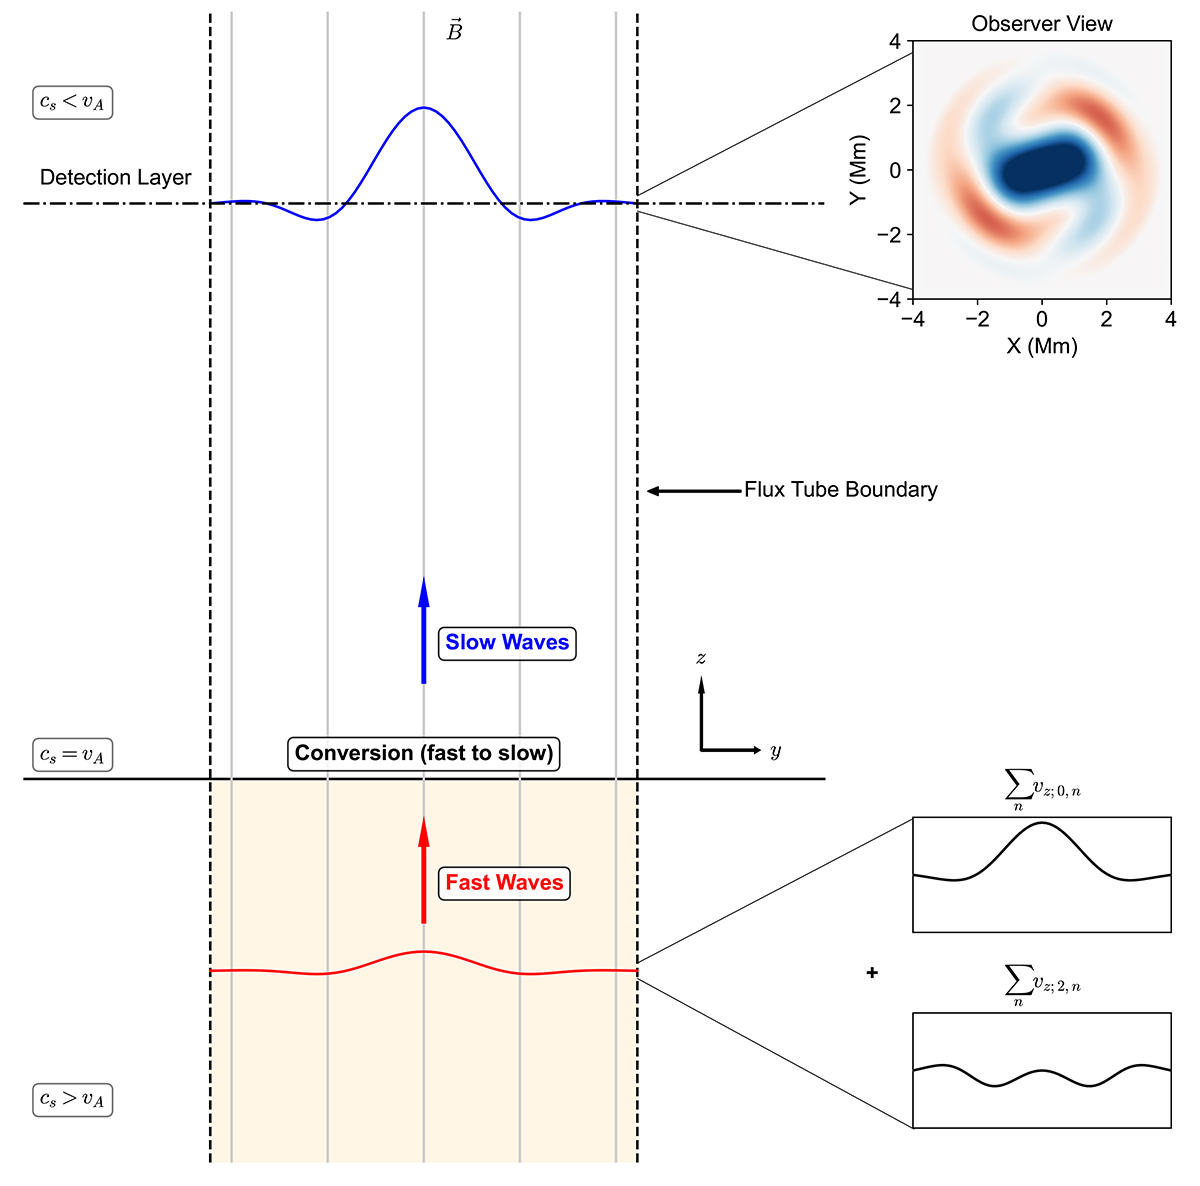
Illustration of our model of umbral oscillations inherited from subphotospheric fast-body modes. The yellow area represents the high-β region (cs > vA) below the sunspot surface, and the white area represents the low-β region (cs < vA). The black solid line between the two regions represents the equipartition layer (cs = vA) where the mode conversion can occur. The gray vertical lines illustrate the magnetic field lines of the flux tube, and the vertical dashed line indicates the boundary of the flux tube. The red line demonstrates the vertical velocity vz of fast body waves, and the blue line represents vz of converted slow waves. The dash-dotted horizontal line represents the detection layer of the chromosphere. The two panels in the bottom right corner show the vertical velocity fluctuation of two azimuthal modes of m = 0 and 2. The top right panel shows a horizontal cross-section view of the modeled oscillation patterns.
Current usage metrics show cumulative count of Article Views (full-text article views including HTML views, PDF and ePub downloads, according to the available data) and Abstracts Views on Vision4Press platform.
Data correspond to usage on the plateform after 2015. The current usage metrics is available 48-96 hours after online publication and is updated daily on week days.
Initial download of the metrics may take a while.