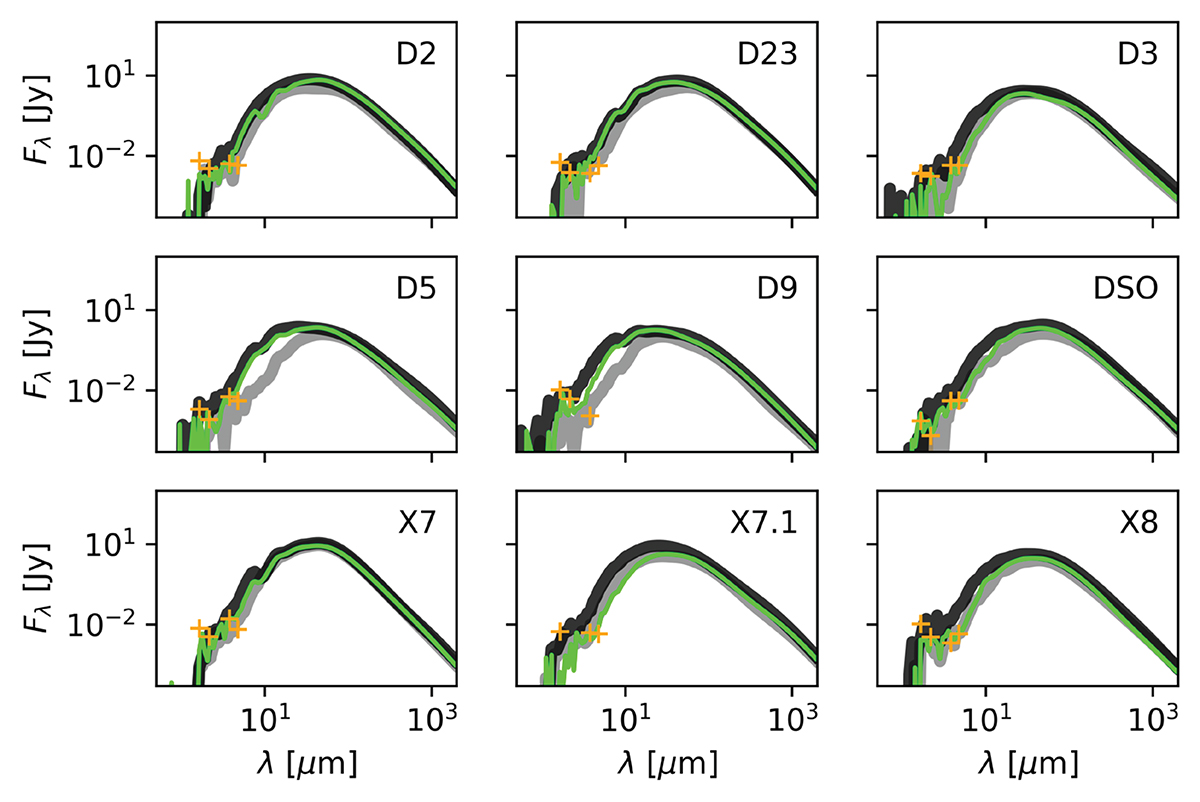
Fig. 9.
Download original image
Best-fit SEDs for some of the dusty sources discussed in this work derived with HYPERION. Due to the low spectral coverage because of the bright radio/submillimeter counterpart of Sgr A*, the analysis is limited to the NIR and MIR domain. We motivate the analysis with the color–color diagram shown in Fig. 8 and find a satisfying representation of the flux density distribution using a Class I model. The only exception is the data point distribution for D9, which is hardly represented by the presented fit (see text for further details).
Current usage metrics show cumulative count of Article Views (full-text article views including HTML views, PDF and ePub downloads, according to the available data) and Abstracts Views on Vision4Press platform.
Data correspond to usage on the plateform after 2015. The current usage metrics is available 48-96 hours after online publication and is updated daily on week days.
Initial download of the metrics may take a while.