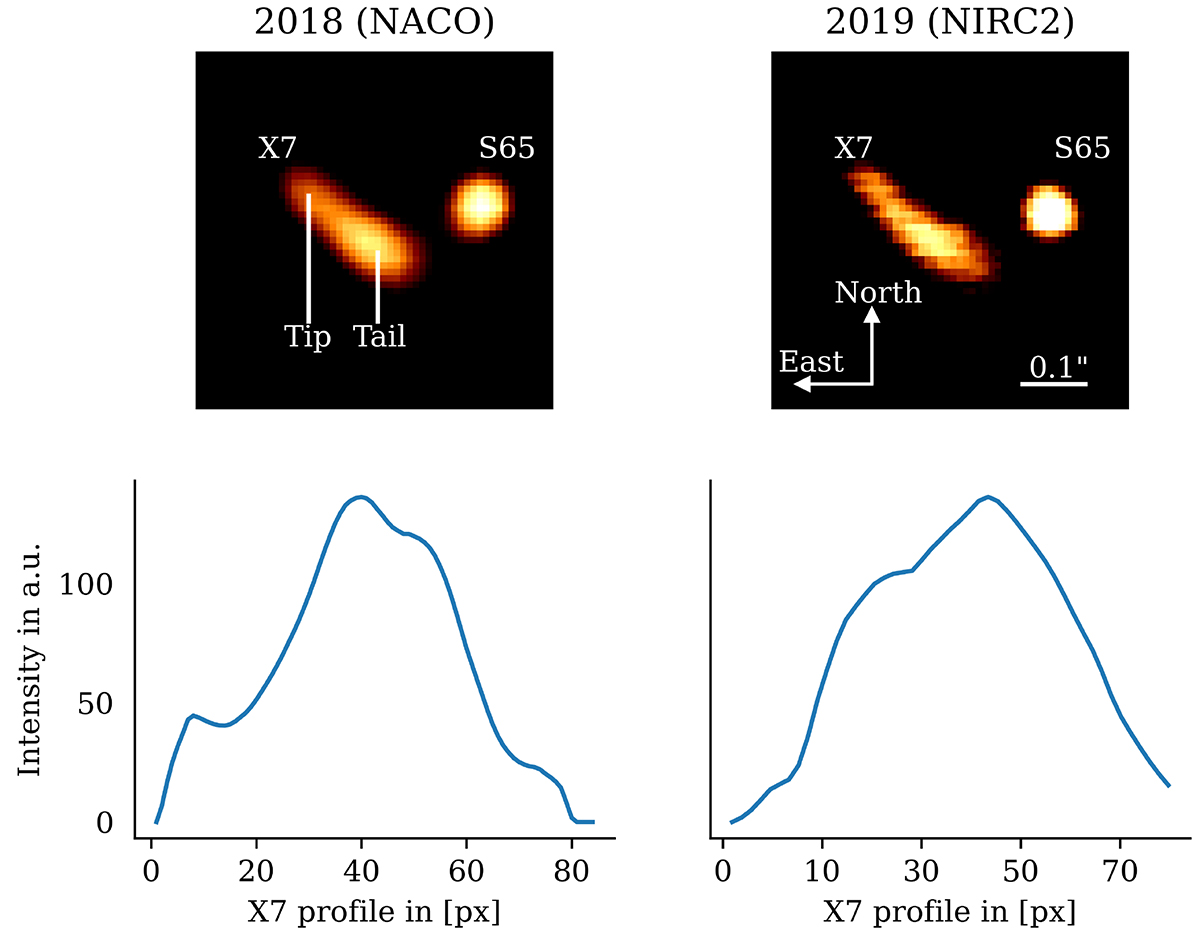
Fig. 14.
Download original image
Radial dust profile of X7 from tip to tail in 2018 and 2019. We rebinned the L-band NACO data to match the pixel scale of the NIRC2 data, i.e., 10 mas. The profile is measured from the tip to the tail, and shows a clear increased dust emission at the back of the bow-shock source. In contrast, the emission of the Doppler-shifted Brγ line does not follow the profile shown here, but appears to be swapped. In other words, the ionized Brγ gas shows a higher intensity at the tip compared to the back of the bow-shock source X7. We refer the interested reader to Figs. 5 and 11 in Peißker et al. (2021b).
Current usage metrics show cumulative count of Article Views (full-text article views including HTML views, PDF and ePub downloads, according to the available data) and Abstracts Views on Vision4Press platform.
Data correspond to usage on the plateform after 2015. The current usage metrics is available 48-96 hours after online publication and is updated daily on week days.
Initial download of the metrics may take a while.