Fig. 11.
Download original image
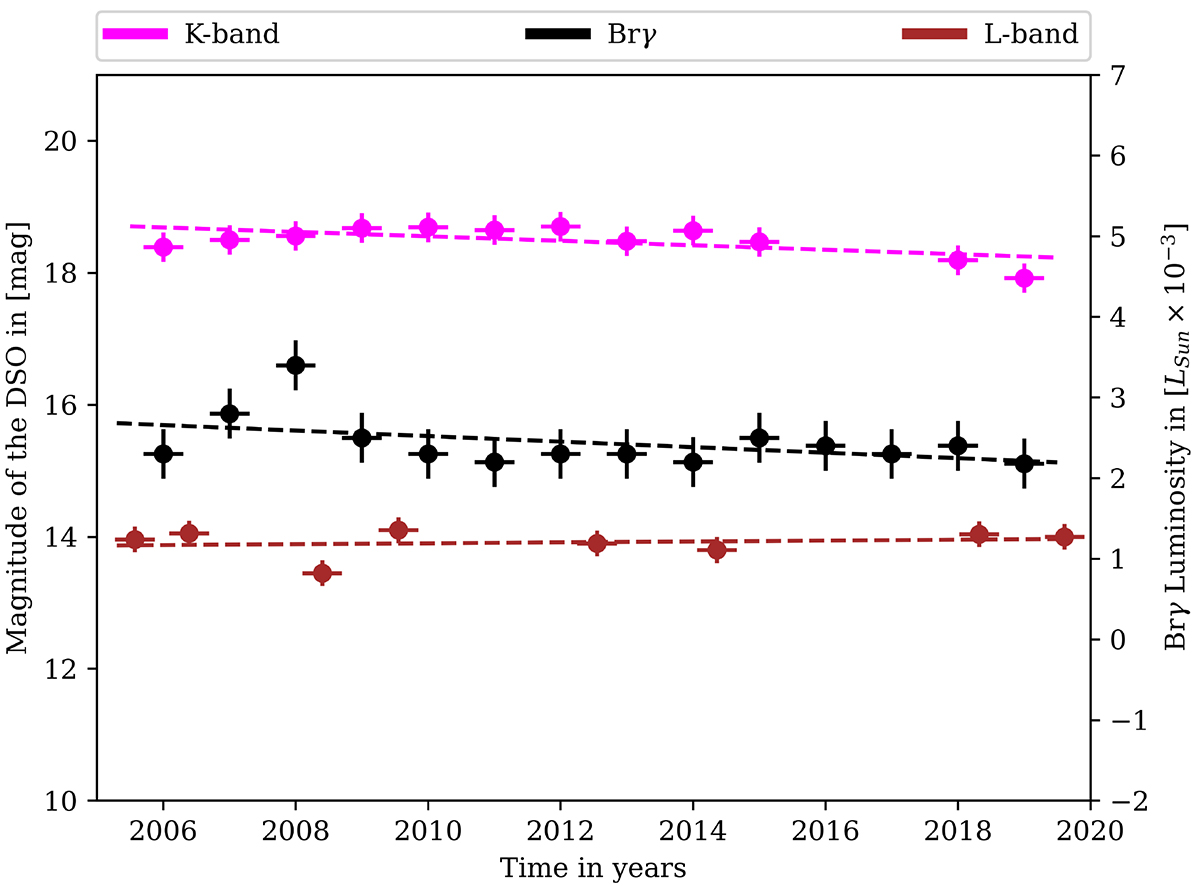
Magnitude of G2/DSO in different wavelengths. The pink data points are adapted from Peißker et al. (2021a), whereas the black and brown data points are incorporated from Pfuhl et al. (2015) and Witzel et al. (2014), respectively. The L-band data points from 2008 (NACO) and 2019 (NIRCAM2) are included. The Brγ line luminosity after 2014 is based on the analysis presented in Peißker et al. (2021a). The dashed line for every data set represents a first-degree polynomial fit and underlines the almost constant magnitude and luminosity in strong contradiction to the expected variation discussed in Gillessen et al. (2012), Ballone et al. (2013), and Pfuhl et al. (2015). Here all the uncertainties are estimated from the standard deviation of the related data set.
Current usage metrics show cumulative count of Article Views (full-text article views including HTML views, PDF and ePub downloads, according to the available data) and Abstracts Views on Vision4Press platform.
Data correspond to usage on the plateform after 2015. The current usage metrics is available 48-96 hours after online publication and is updated daily on week days.
Initial download of the metrics may take a while.