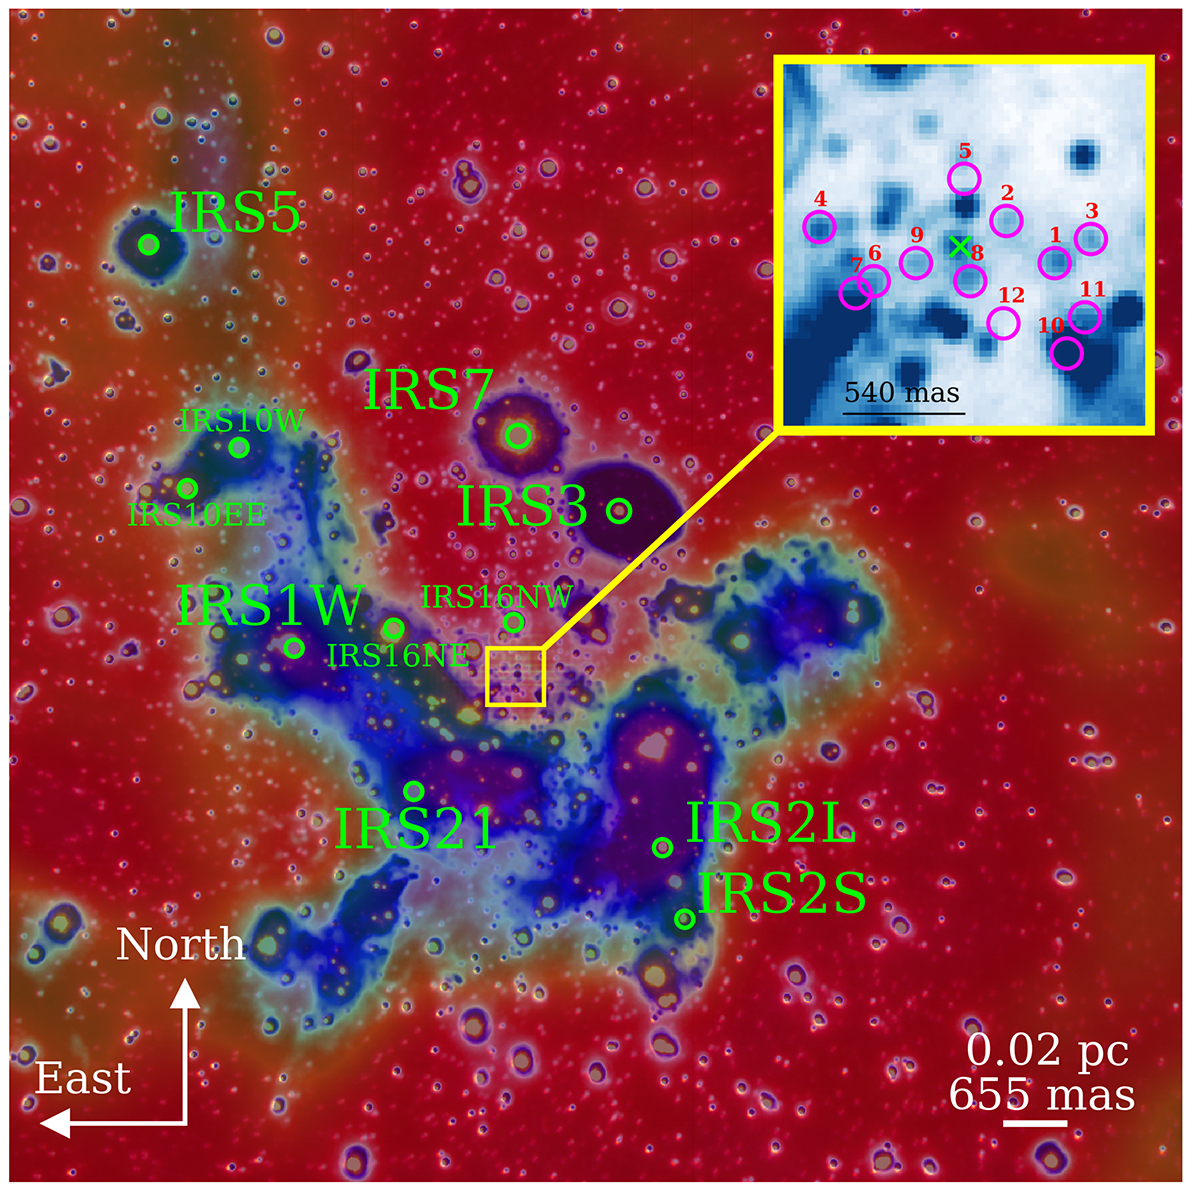
Fig. 1.

Download original image
Multiwavelength finding chart of the inner ≈0.4 pc of the Galactic center observed in the K-band (red) and L-band (blue) observed with NACO (VLT). The 100 GHz observations carried out with ALMA (green) and are based on the reduced data analyzed in Moser et al. (2017). The brightest K-band (IRS7) and L-band source (IRS3) are indicated. The inset shows a zoomed-in view of the yellow box where we mark the position of Sgr A* with a green cross (×). The positions of all dusty sources analyzed in this work are shown as a magenta circle. North is up; east is to the left.
Current usage metrics show cumulative count of Article Views (full-text article views including HTML views, PDF and ePub downloads, according to the available data) and Abstracts Views on Vision4Press platform.
Data correspond to usage on the plateform after 2015. The current usage metrics is available 48-96 hours after online publication and is updated daily on week days.
Initial download of the metrics may take a while.


