Fig. 17.
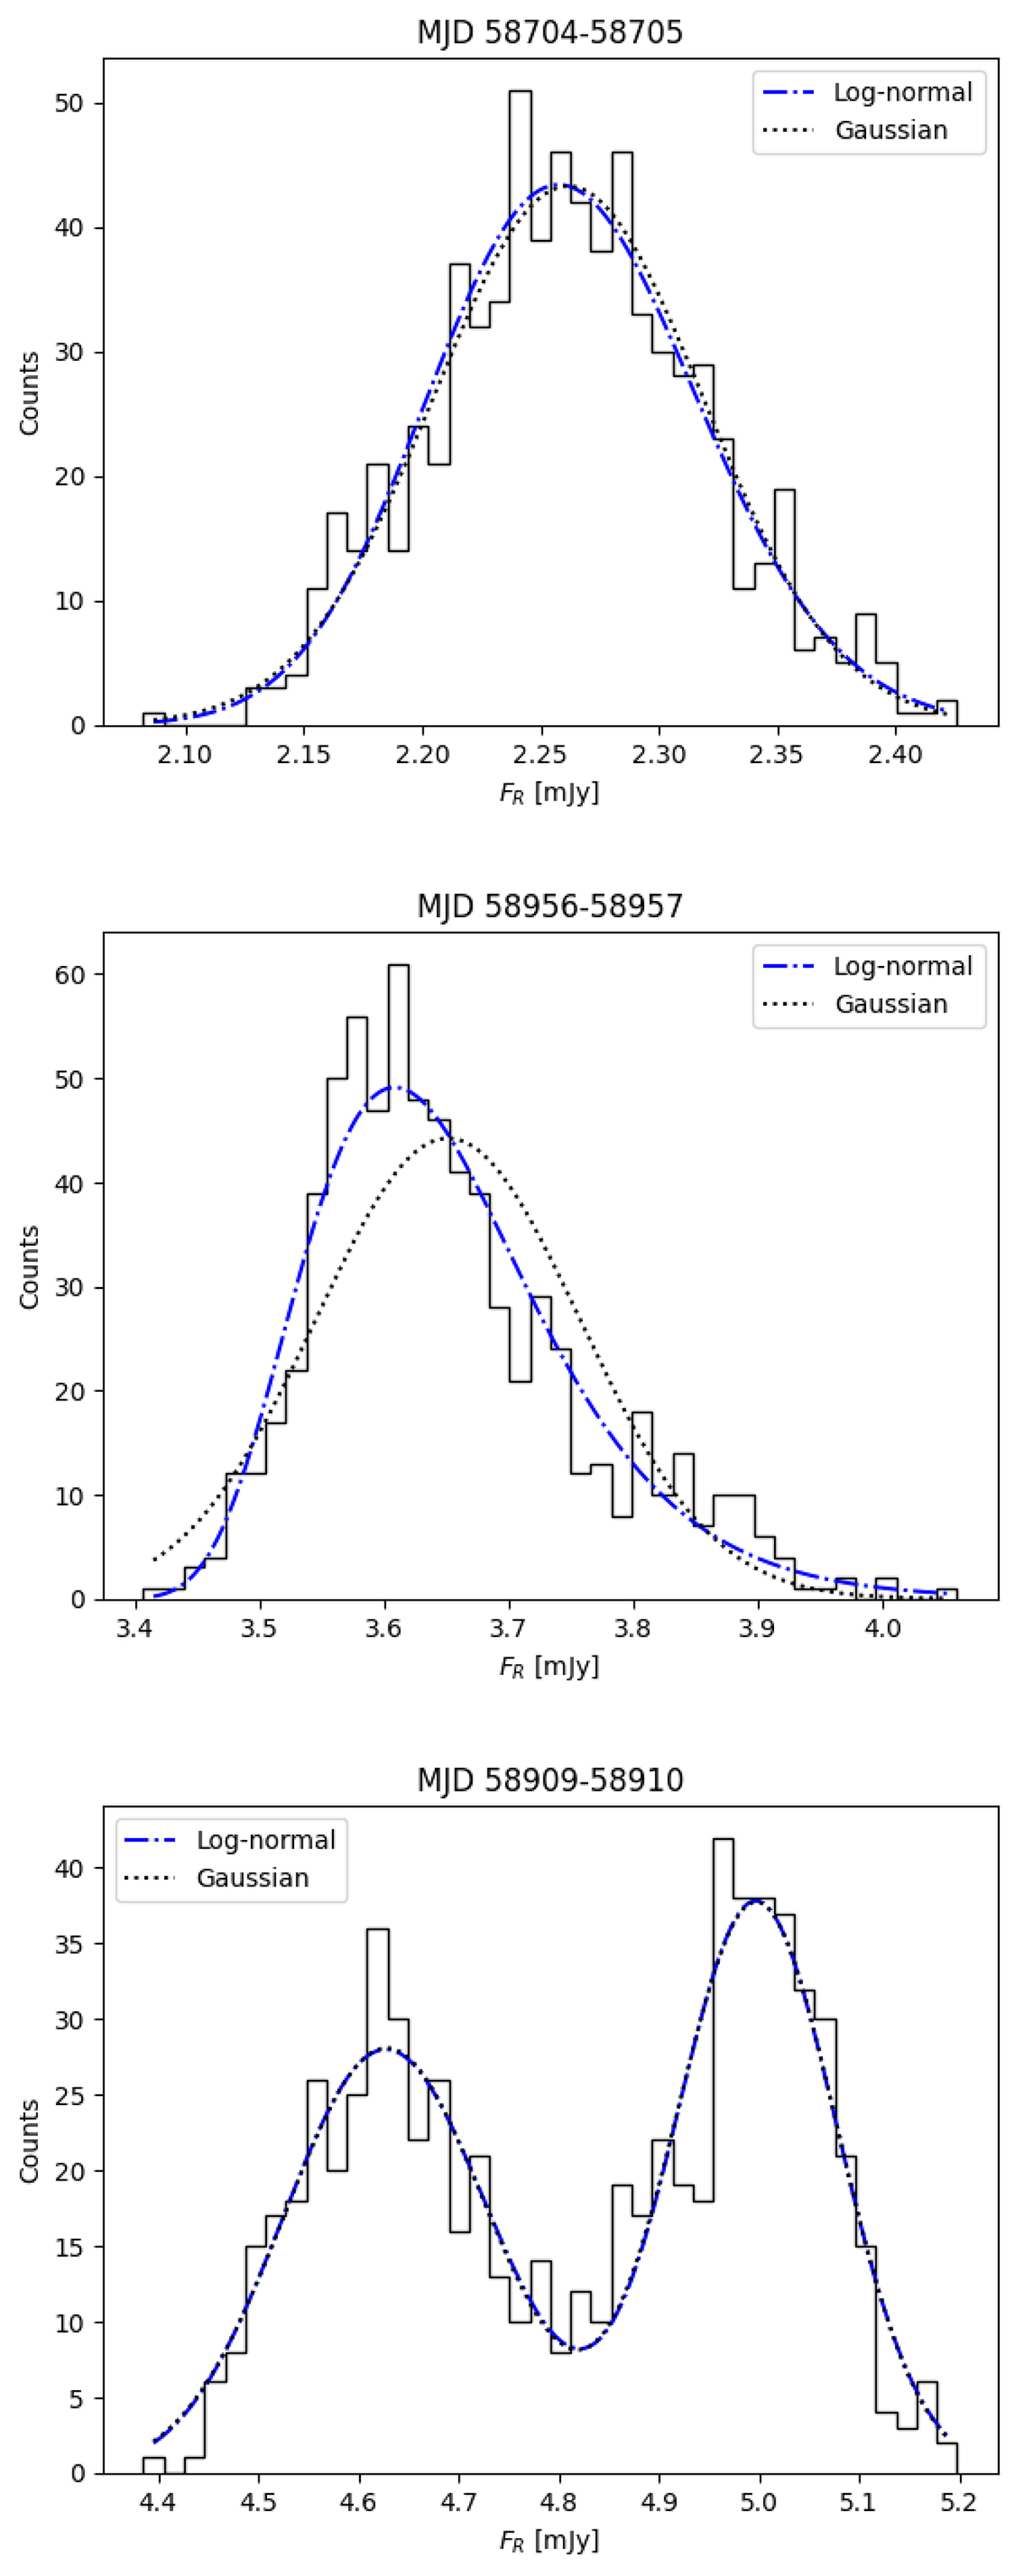
Download original image
Examples of IDV flux distributions for three 1 day time intervals. Black solid lines represent the histograms of the distributions. Black dotted and blue dashed-dotted lines correspond to the Gaussian and log-normal fits to the data. Top: flux distribution with both a compatible Gaussian and log-normal distribution. Middle: flux distribution with a preferential log-normal distribution. Bottom: multimodal flux distribution.
Current usage metrics show cumulative count of Article Views (full-text article views including HTML views, PDF and ePub downloads, according to the available data) and Abstracts Views on Vision4Press platform.
Data correspond to usage on the plateform after 2015. The current usage metrics is available 48-96 hours after online publication and is updated daily on week days.
Initial download of the metrics may take a while.