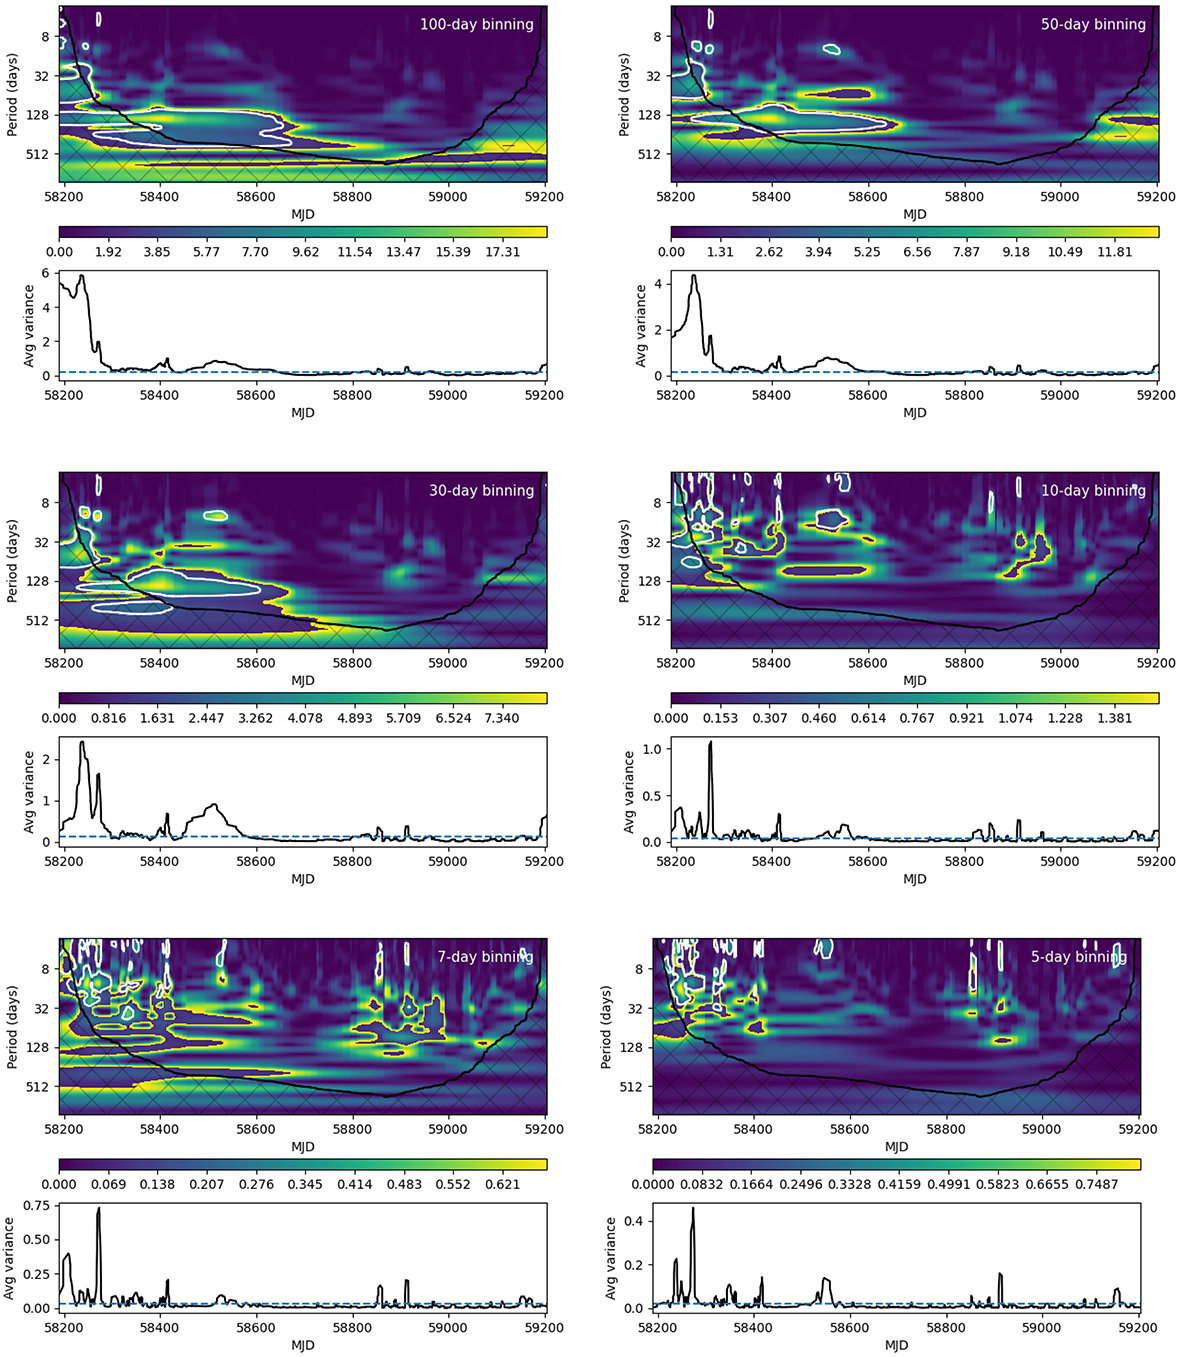
Fig. 11.
Download original image
Wavelet analysis performed on the detrended R-band light curves. Top left: 100 day binning. Top right: 50 day binning. Middle left: 30 day binning. Middle right: 10 day binning. Bottom left: 7 day binning. Bottom right: 5 day binning. The top panels correspond to the time-frequency power spectra of each light curve. White contours represent variability signatures with a significance of > 3σ (> 99.73% confidence level). The gray grid represents the cone of influence region affected by edge effects. The bottom panels represent the averaged variance between 1 day and the corresponding binning. The horizontal dashed line represents the 3σ (99.73%) confidence level.
Current usage metrics show cumulative count of Article Views (full-text article views including HTML views, PDF and ePub downloads, according to the available data) and Abstracts Views on Vision4Press platform.
Data correspond to usage on the plateform after 2015. The current usage metrics is available 48-96 hours after online publication and is updated daily on week days.
Initial download of the metrics may take a while.