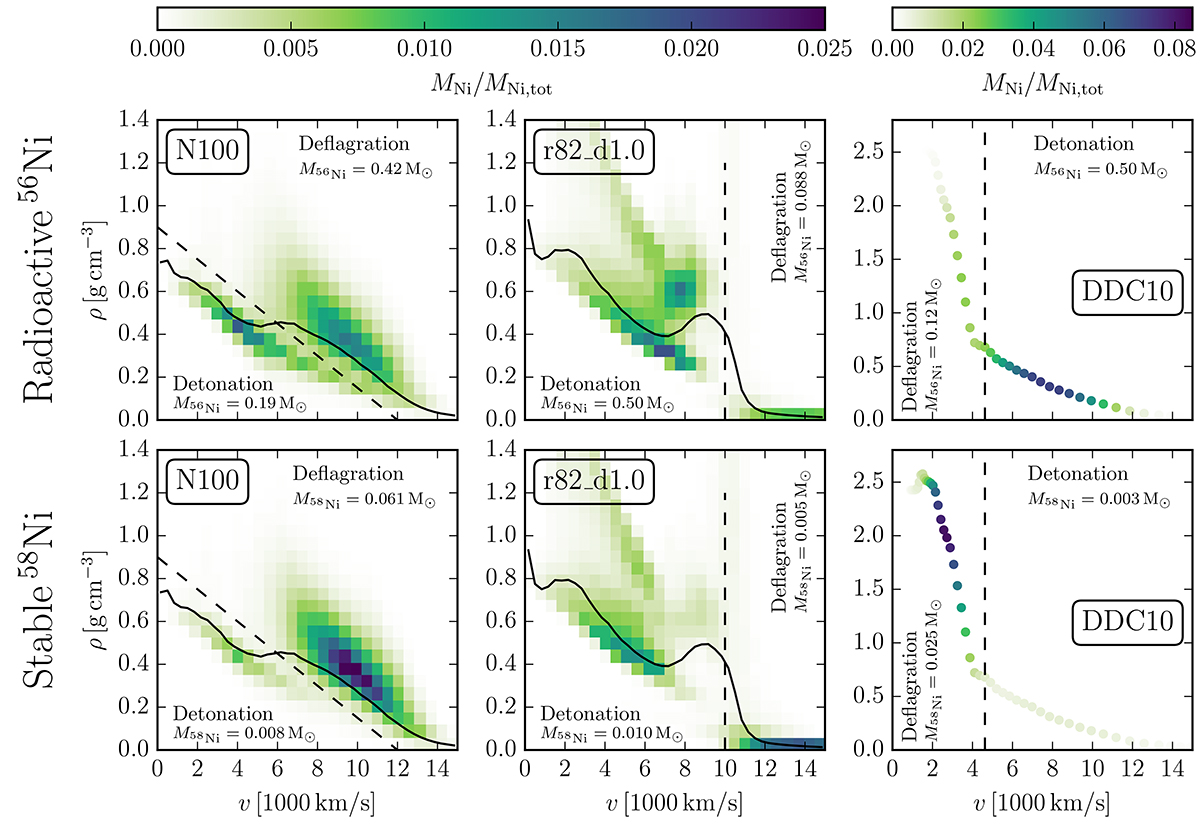
Fig. 1.
Download original image
Distribution of radioactive 56Ni (top row) and stable 58Ni (bottom row) in density–velocity space 100 s after the explosion. Each histogram is normalised individually to the total mass of the type of nickel it shows. The columns show different Chandrasekhar-mass explosion models: a 3D delayed detonation (N100; Seitenzahl et al. 2013), a 3D gravitationally confined detonation (r82.d1.0; Lach et al. 2022b), and a 1D delayed detonation (DDC10; Blondin et al. 2013). The solid line in the left and middle panels shows the spherically averaged density profile of the total mass of the ejecta. The dashed lines indicate if nickel was synthesised in the deflagration or in the detonation. In the 3D models the deflagration ashes are located at higher velocities, i.e. further out in the ejecta, than the detonation ashes. In the 1D model this hierarchy is inverted. In the 3D models nickel is distributed over a wide range of densities at a fixed velocity, so spherical averaging 3D ejecta significantly changes their physical properties.
Current usage metrics show cumulative count of Article Views (full-text article views including HTML views, PDF and ePub downloads, according to the available data) and Abstracts Views on Vision4Press platform.
Data correspond to usage on the plateform after 2015. The current usage metrics is available 48-96 hours after online publication and is updated daily on week days.
Initial download of the metrics may take a while.