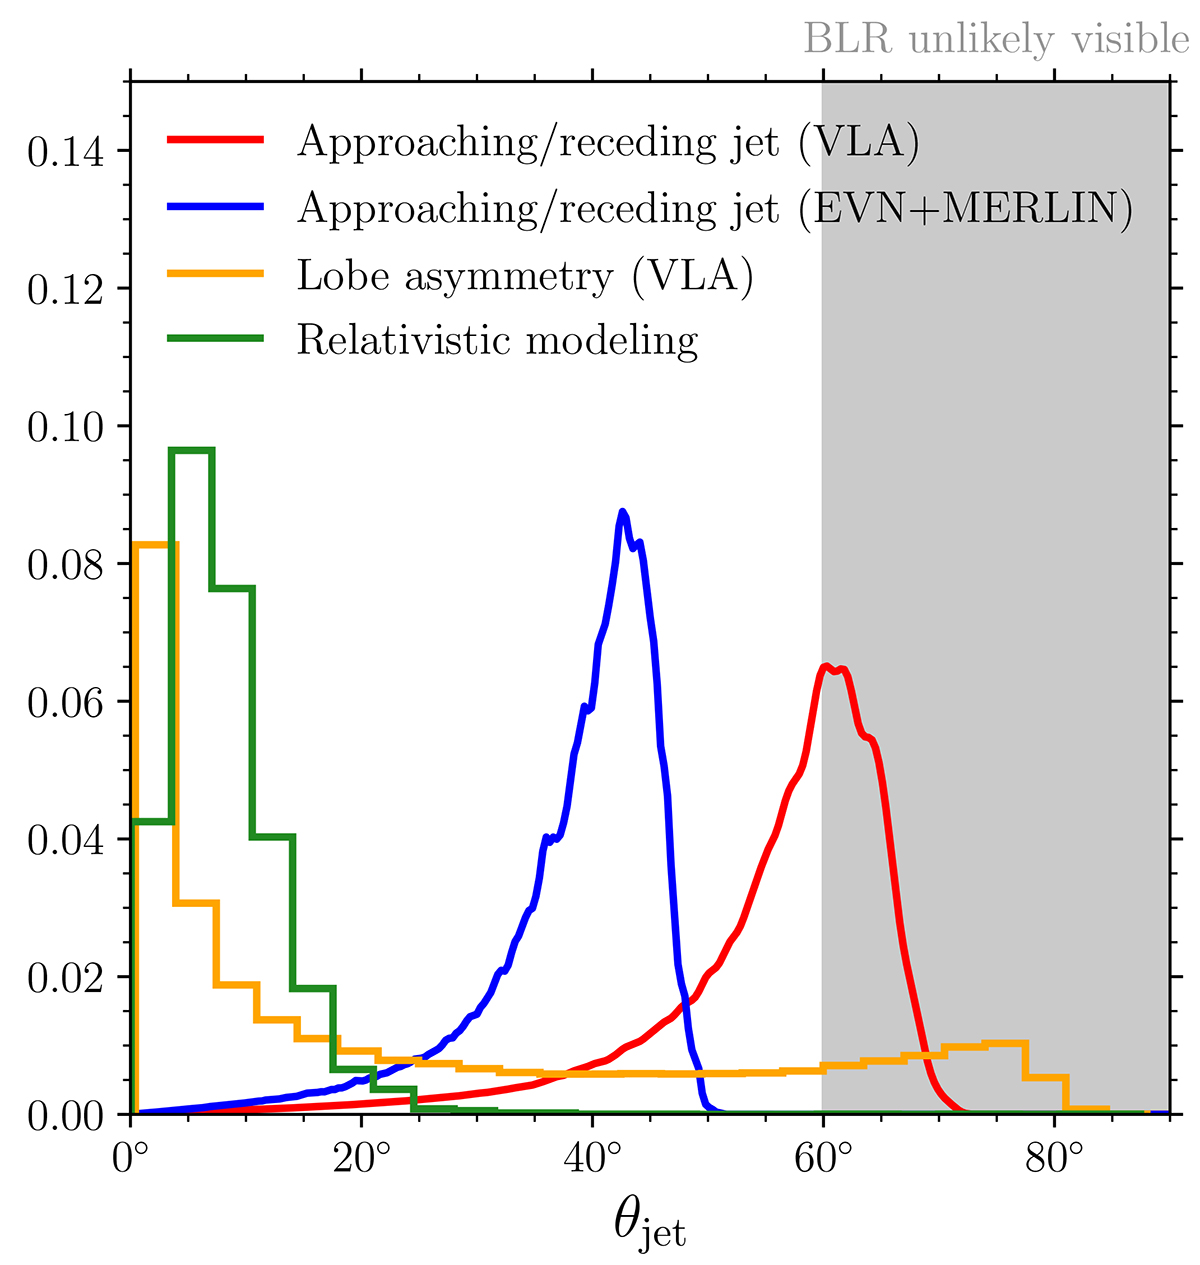
Fig. 6.
Download original image
Posterior distribution of the jet viewing angle (θjet). The red (blue) curve shows results from the approaching and receding jet brightness method (Sect. 4.2.1) using data from archival VLA (EVN+MERLIN) observations. The yellow histogram shows results from the lobe asymmetry method (Sect. 4.2.2), adopting a log-uniform prior on the source age in the range 0.1 ≤ tage/Myr ≤ 40. The green histogram shows the posterior on θjet from our relativistic model (Sect. 3). The gray shaded region corresponds to viewing angles that are disfavored by the observations of broad lines (BLR) in the optical spectrum of the core.
Current usage metrics show cumulative count of Article Views (full-text article views including HTML views, PDF and ePub downloads, according to the available data) and Abstracts Views on Vision4Press platform.
Data correspond to usage on the plateform after 2015. The current usage metrics is available 48-96 hours after online publication and is updated daily on week days.
Initial download of the metrics may take a while.