Fig. 5.
Download original image
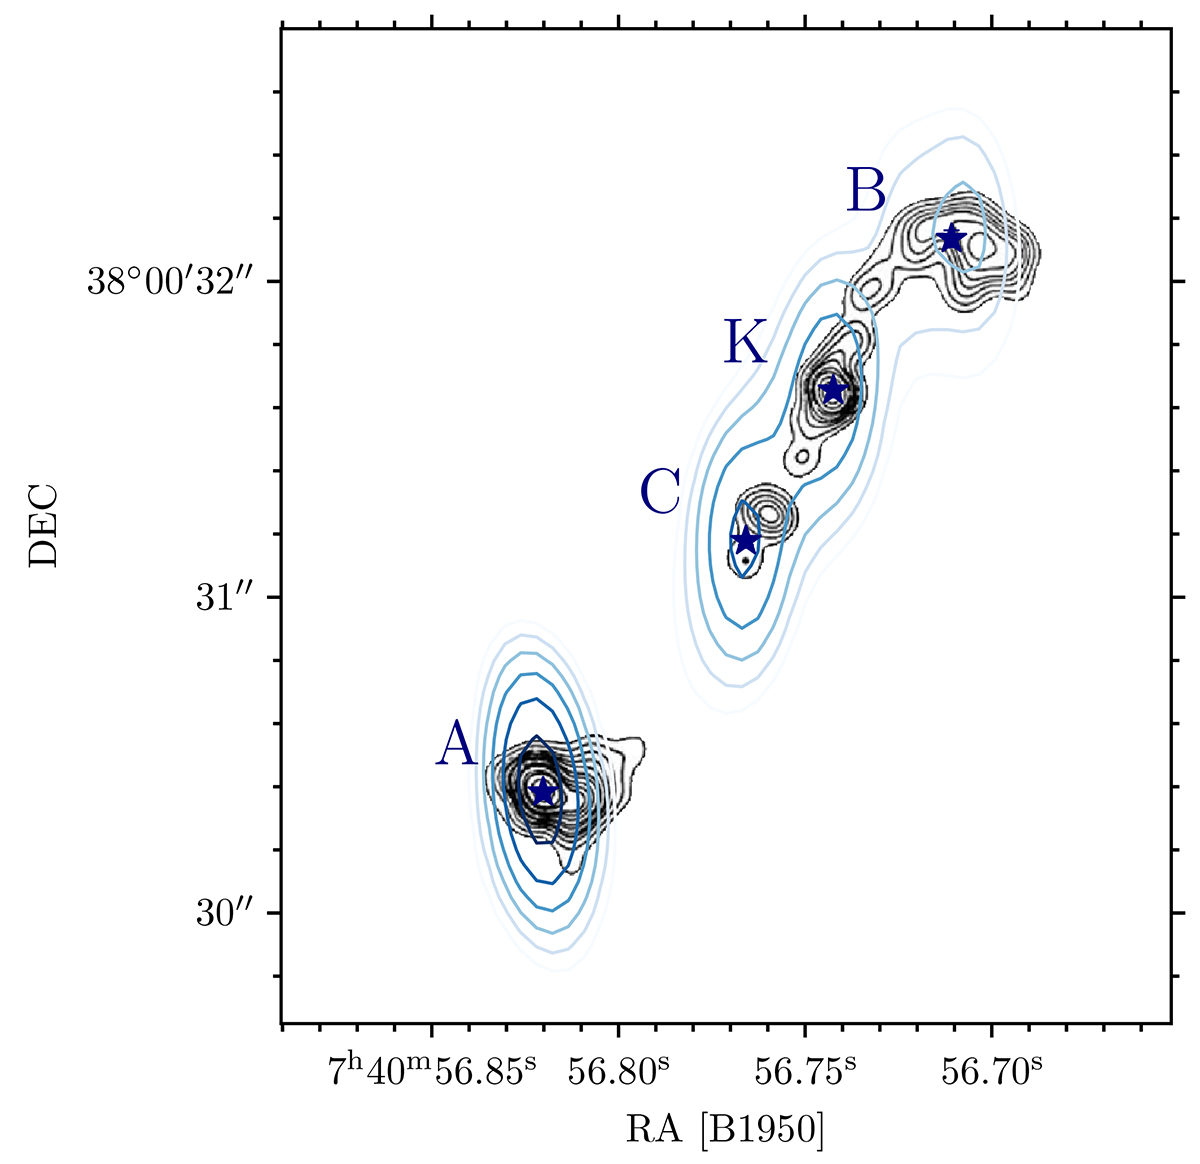
Surface brightness contours of the reconstructed image from archival VLA and EVN+MERLIN observations of 3C 186 at 8.4 GHz and 1.7 GHz, respectively. Blue curves indicate the VLA observation; we show six contours of constant surface brightness at 8.4 GHz, logarithmically spaced between 10% and 80% of the peak surface brightness (33.3 mJy beam−1). Black curves in the background refer to the higher resolution EVN+MERLIN image (Spencer et al. 1991). Blue stars mark the centers of four elliptical Gaussian components, which we label A (lobe of the receding jet), B (lobe of the approaching jet), C (core), and K (knot).
Current usage metrics show cumulative count of Article Views (full-text article views including HTML views, PDF and ePub downloads, according to the available data) and Abstracts Views on Vision4Press platform.
Data correspond to usage on the plateform after 2015. The current usage metrics is available 48-96 hours after online publication and is updated daily on week days.
Initial download of the metrics may take a while.