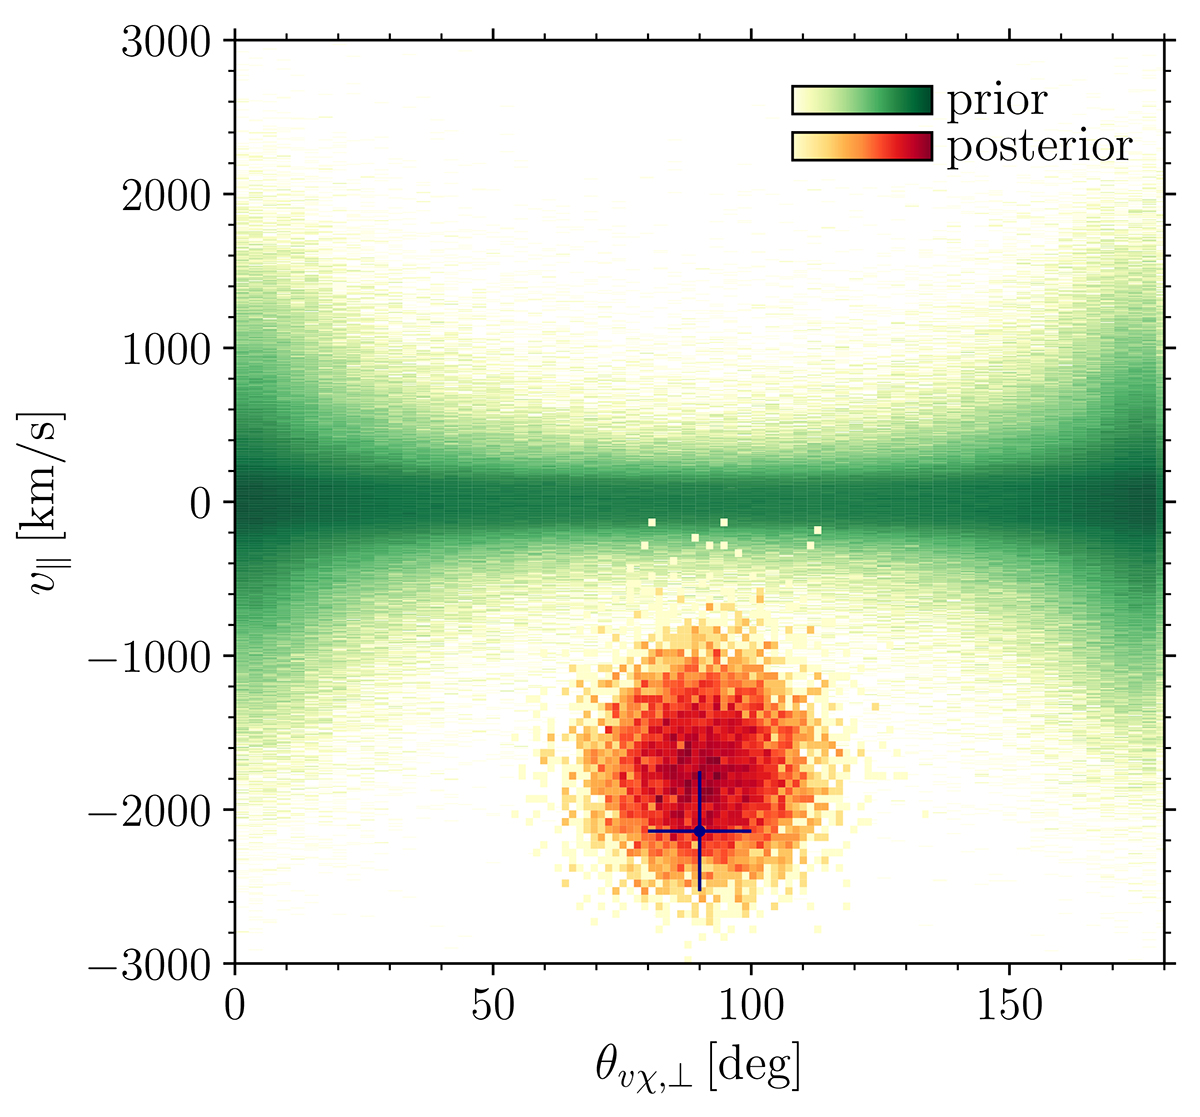
Fig. 3.

Download original image
Prior and posterior distributions for the projection of the kick velocity on the line of sight (v∥) and the angle between the spin and kick projections onto the plane of the sky (θvχ, ⊥). The green distribution shows the uninformative prior described in Sect. 3. The posterior distribution sampled with our MCMC run is shown in red. Darker (lighter) colors correspond to high (low) density regions. The blue scatter point with error bars indicates the observational constraints where our bi-variate Gaussian likelihood is centered.
Current usage metrics show cumulative count of Article Views (full-text article views including HTML views, PDF and ePub downloads, according to the available data) and Abstracts Views on Vision4Press platform.
Data correspond to usage on the plateform after 2015. The current usage metrics is available 48-96 hours after online publication and is updated daily on week days.
Initial download of the metrics may take a while.


