Fig. 9
Download original image
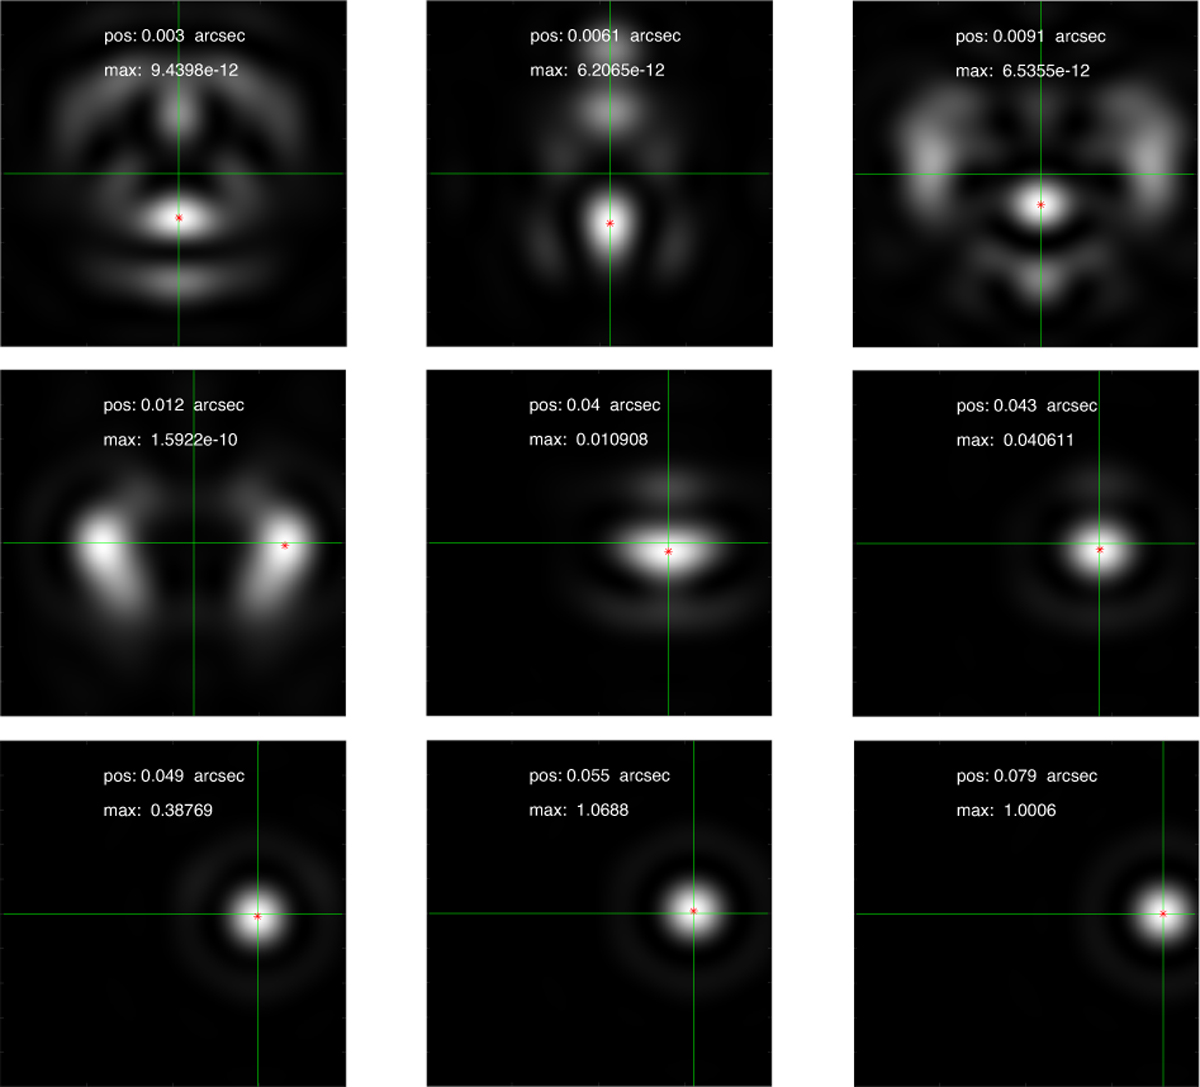
Examples of PSF responses for various point sources (green cross) and the observed PSF maximum (red point). Below 40 mas, these positions do not coincide. After that, there is a shift between these positions until 80 mas. The maximum intensity value and the exact position of the source point that is moved in a single direction are noted in the images. The wavefront used is that of the petal occulter for NW2.
Current usage metrics show cumulative count of Article Views (full-text article views including HTML views, PDF and ePub downloads, according to the available data) and Abstracts Views on Vision4Press platform.
Data correspond to usage on the plateform after 2015. The current usage metrics is available 48-96 hours after online publication and is updated daily on week days.
Initial download of the metrics may take a while.