Open Access
Fig. 2
Download original image
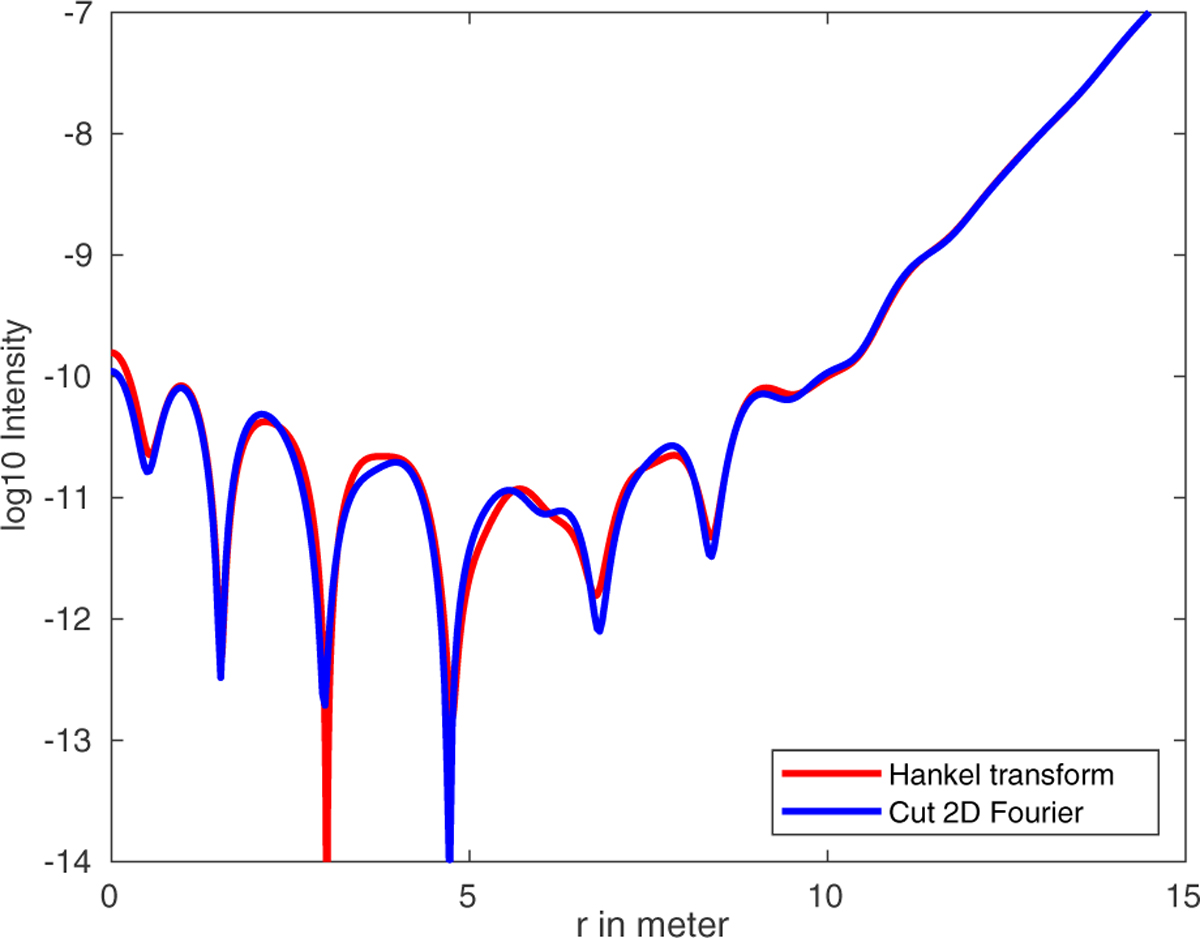
Comparison between cuts of the intensity diffraction pattern for the apodized occulter of the NW2 configuration at 500 nm (central shadow, log10 scale). The red curve, computed using a Hankel transform, is almost identical to the blue curve, which is a radial cut of the pattern obtained using 2D Fourier transforms.
Current usage metrics show cumulative count of Article Views (full-text article views including HTML views, PDF and ePub downloads, according to the available data) and Abstracts Views on Vision4Press platform.
Data correspond to usage on the plateform after 2015. The current usage metrics is available 48-96 hours after online publication and is updated daily on week days.
Initial download of the metrics may take a while.