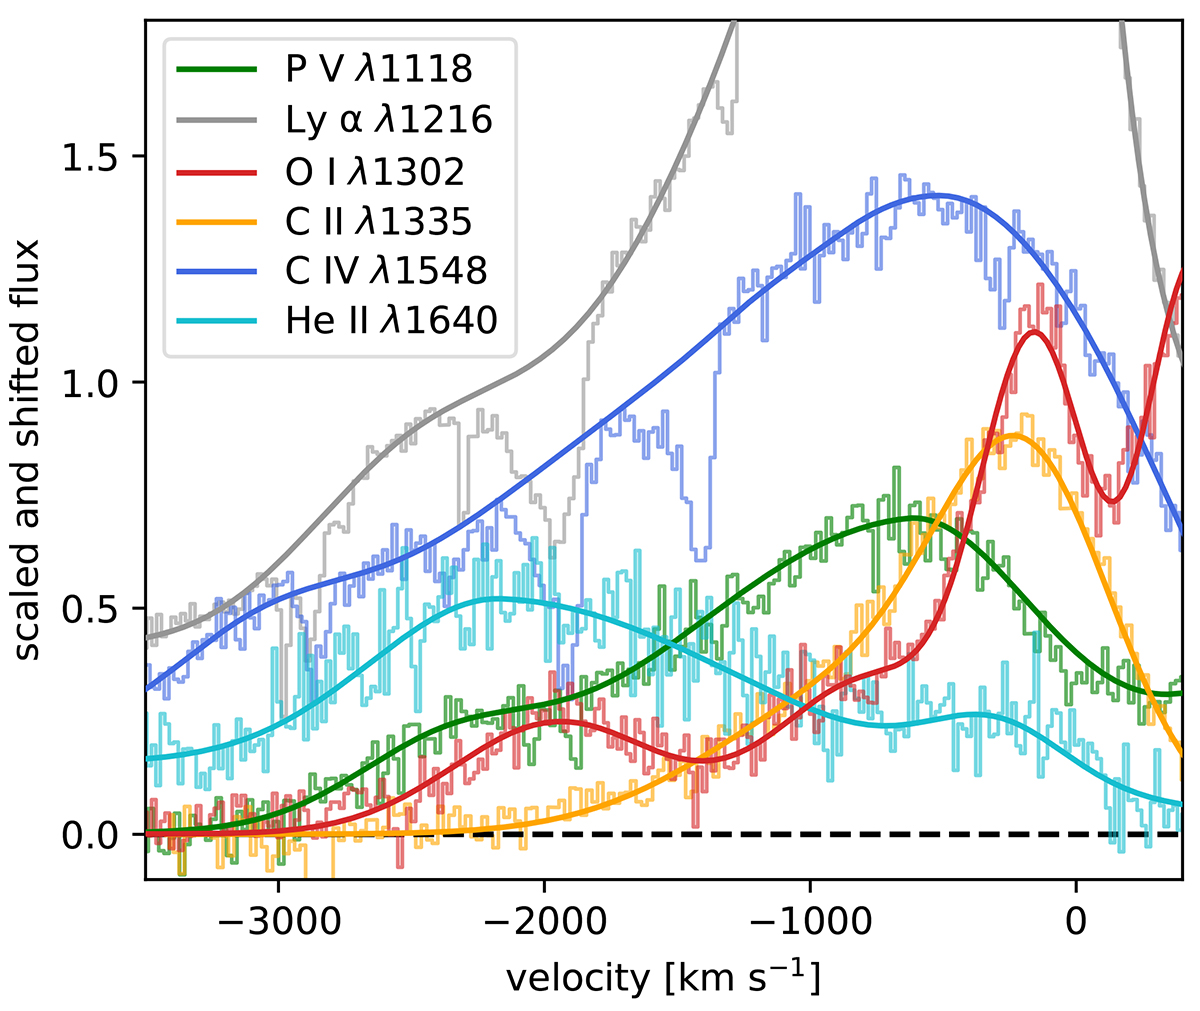
Fig. 8.
Download original image
Continuum-subtracted emission lines displayed as a function of velocity relative to the systemic redshift of z = 0.061169. The lines are not corrected for blending with nearby features. Besides Lyα, the displayed lines are doublets, with the velocity shift derived for the blue component. Note that the flux increase at approximately −2300 km s−1 in the Lyα profile coincides with the position of the Si IIIλ1206.50. The flux enhancement at the velocity corresponding to the absorption system B (−1950 km s−1) in other lines is addressed in the text. Lyα and C IV are scaled for visualisation purposes.
Current usage metrics show cumulative count of Article Views (full-text article views including HTML views, PDF and ePub downloads, according to the available data) and Abstracts Views on Vision4Press platform.
Data correspond to usage on the plateform after 2015. The current usage metrics is available 48-96 hours after online publication and is updated daily on week days.
Initial download of the metrics may take a while.