Open Access
Fig. 7.
Download original image
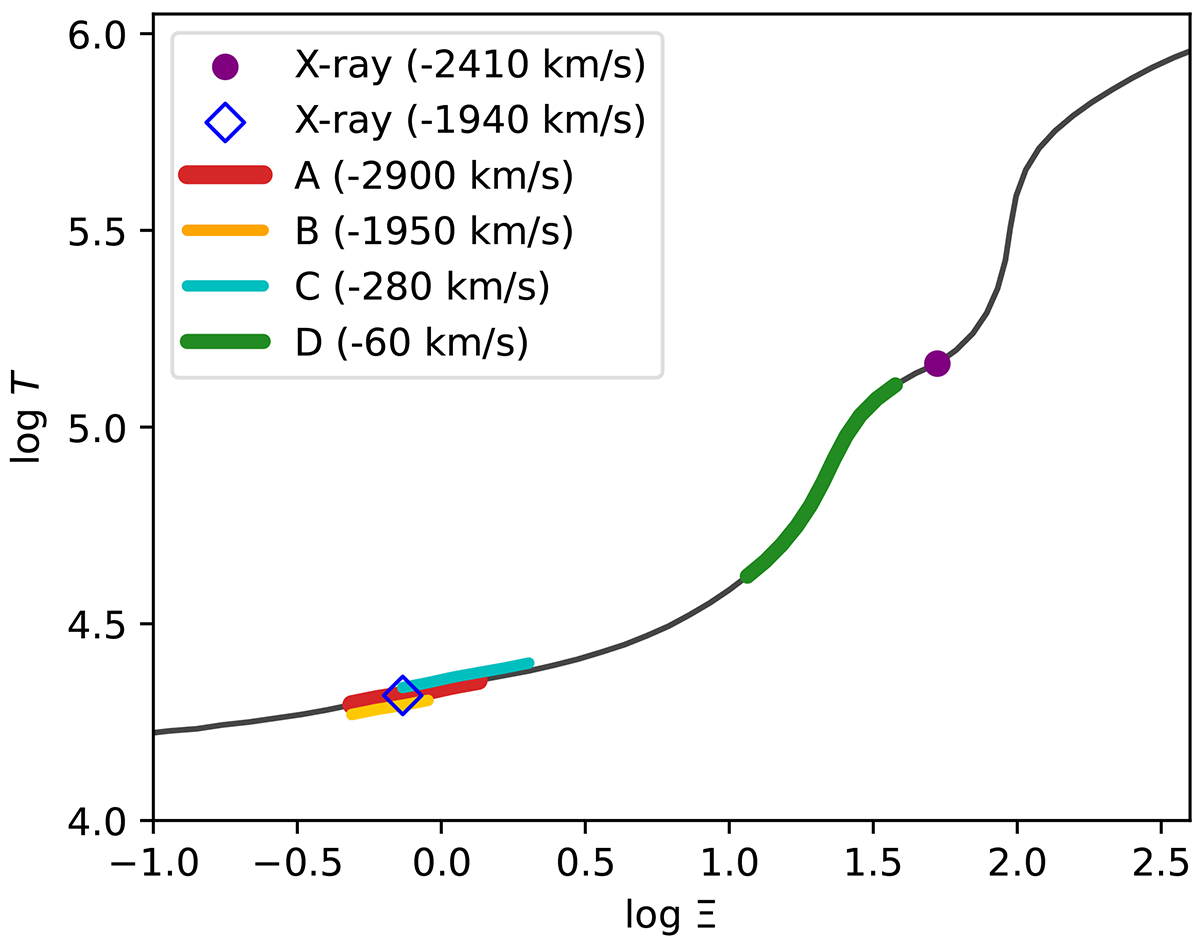
Thermal stability curve for I Zw 1. The ionisation pressure parameter values of the UV and X-ray photoionised absorbers are shown on the curve. For absorber A, the minimal value is obtained as the crossing of the 1σ contour in Fig. 6 and the lower limit from N V.
Current usage metrics show cumulative count of Article Views (full-text article views including HTML views, PDF and ePub downloads, according to the available data) and Abstracts Views on Vision4Press platform.
Data correspond to usage on the plateform after 2015. The current usage metrics is available 48-96 hours after online publication and is updated daily on week days.
Initial download of the metrics may take a while.