Fig. 6.
Download original image
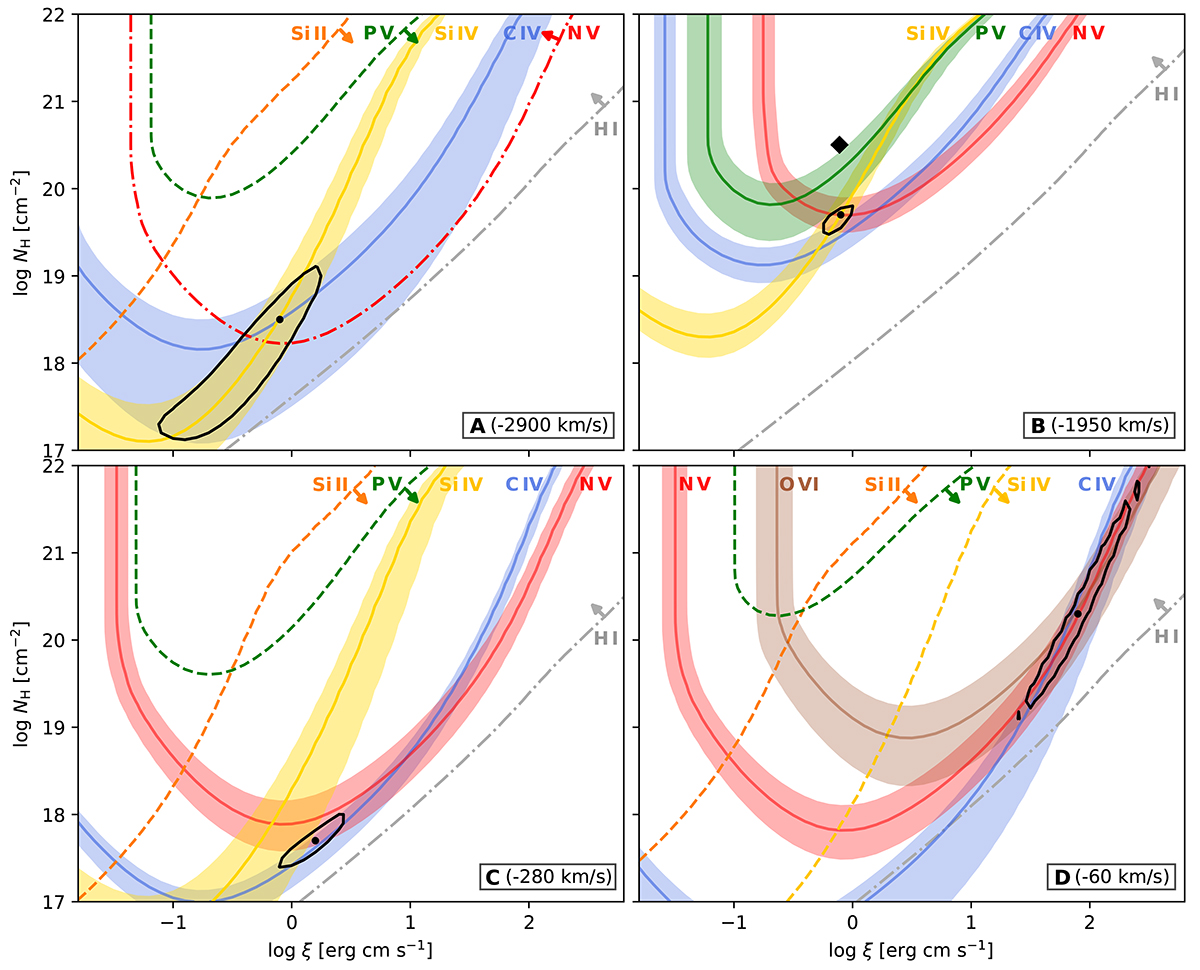
Photoionisation model constraints on the UV absorbers in I Zw 1. The measured column densities and the associated uncertainties of each ion are represented by the coloured bands, with the mean value depicted with the solid line. 3σ upper limits for undetected lines are shown as dashed lines. The dash-dotted lines, representing the measured column densities of H I and N V (in the upper left panel), are regarded as lower limits. For these limits, the permitted portion of the parameter space is indicated with an arrow. In each panel, the black dot depicts the minimal χ2 value, surrounded by a 1σ contour. In the upper right panel (absorber B), the location of the X-ray warm absorber seen at the same radial velocity is represented by a diamond marker, with its size covering the associated 1σ uncertainties.
Current usage metrics show cumulative count of Article Views (full-text article views including HTML views, PDF and ePub downloads, according to the available data) and Abstracts Views on Vision4Press platform.
Data correspond to usage on the plateform after 2015. The current usage metrics is available 48-96 hours after online publication and is updated daily on week days.
Initial download of the metrics may take a while.