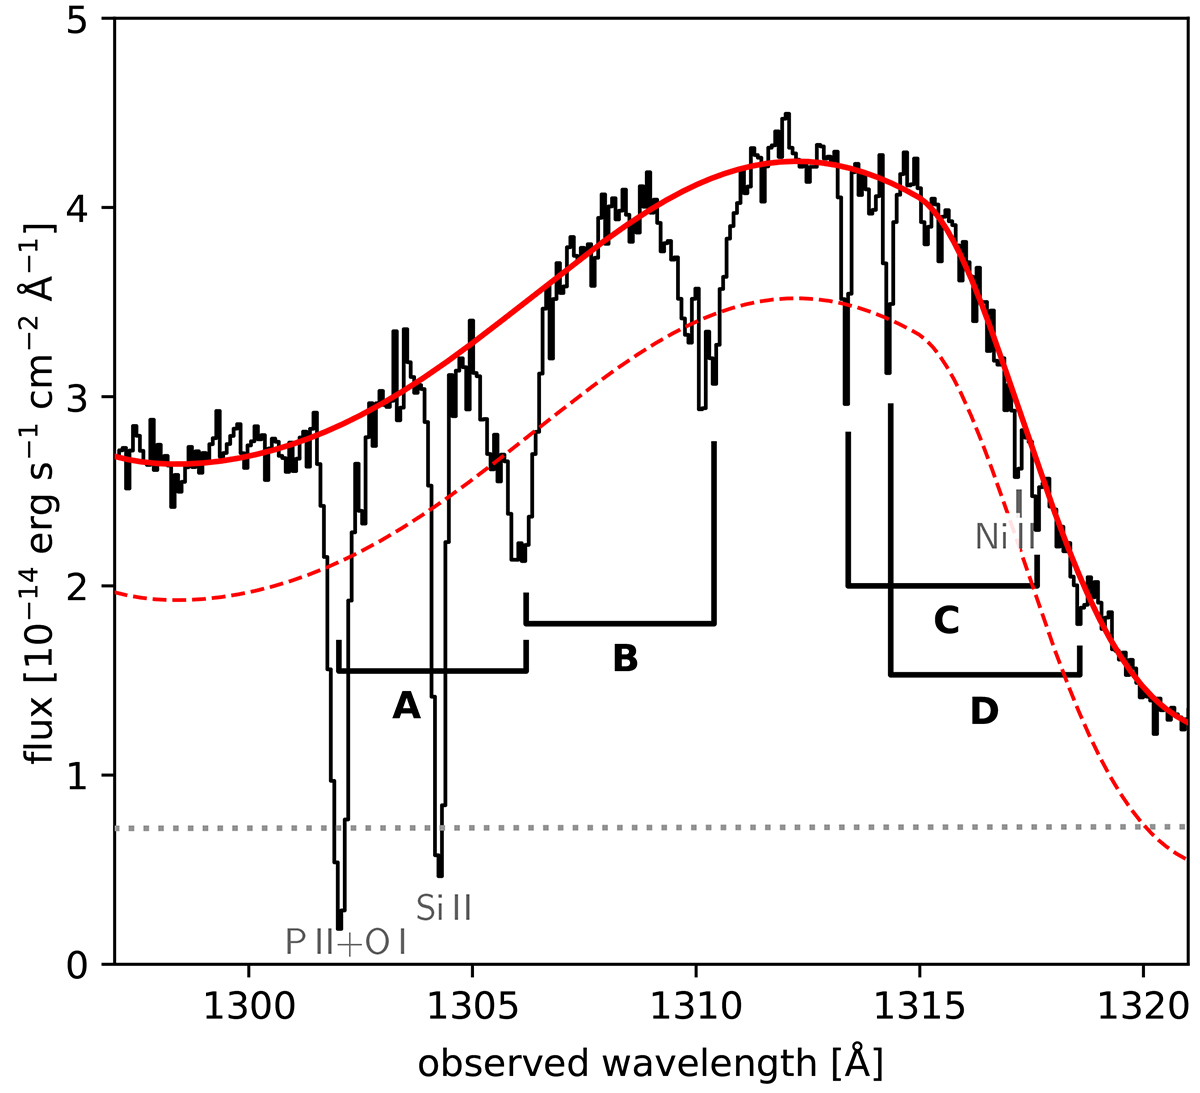
Fig. 5.
Download original image
HST-COS view of the I Zw 1 absorption-affected N V emission feature. The continuum level is depicted as a grey dotted line, the emission line profile as a red dashed line and the total modelled emission is shown as a solid red line. The positions of N V absorption features (A, B, C, and D) are labelled, as well as the identified ISM lines. The strong P II+O I blend overlaps the blue component of the most blue-shifted N V absorption system.
Current usage metrics show cumulative count of Article Views (full-text article views including HTML views, PDF and ePub downloads, according to the available data) and Abstracts Views on Vision4Press platform.
Data correspond to usage on the plateform after 2015. The current usage metrics is available 48-96 hours after online publication and is updated daily on week days.
Initial download of the metrics may take a while.