Fig. 4.
Download original image
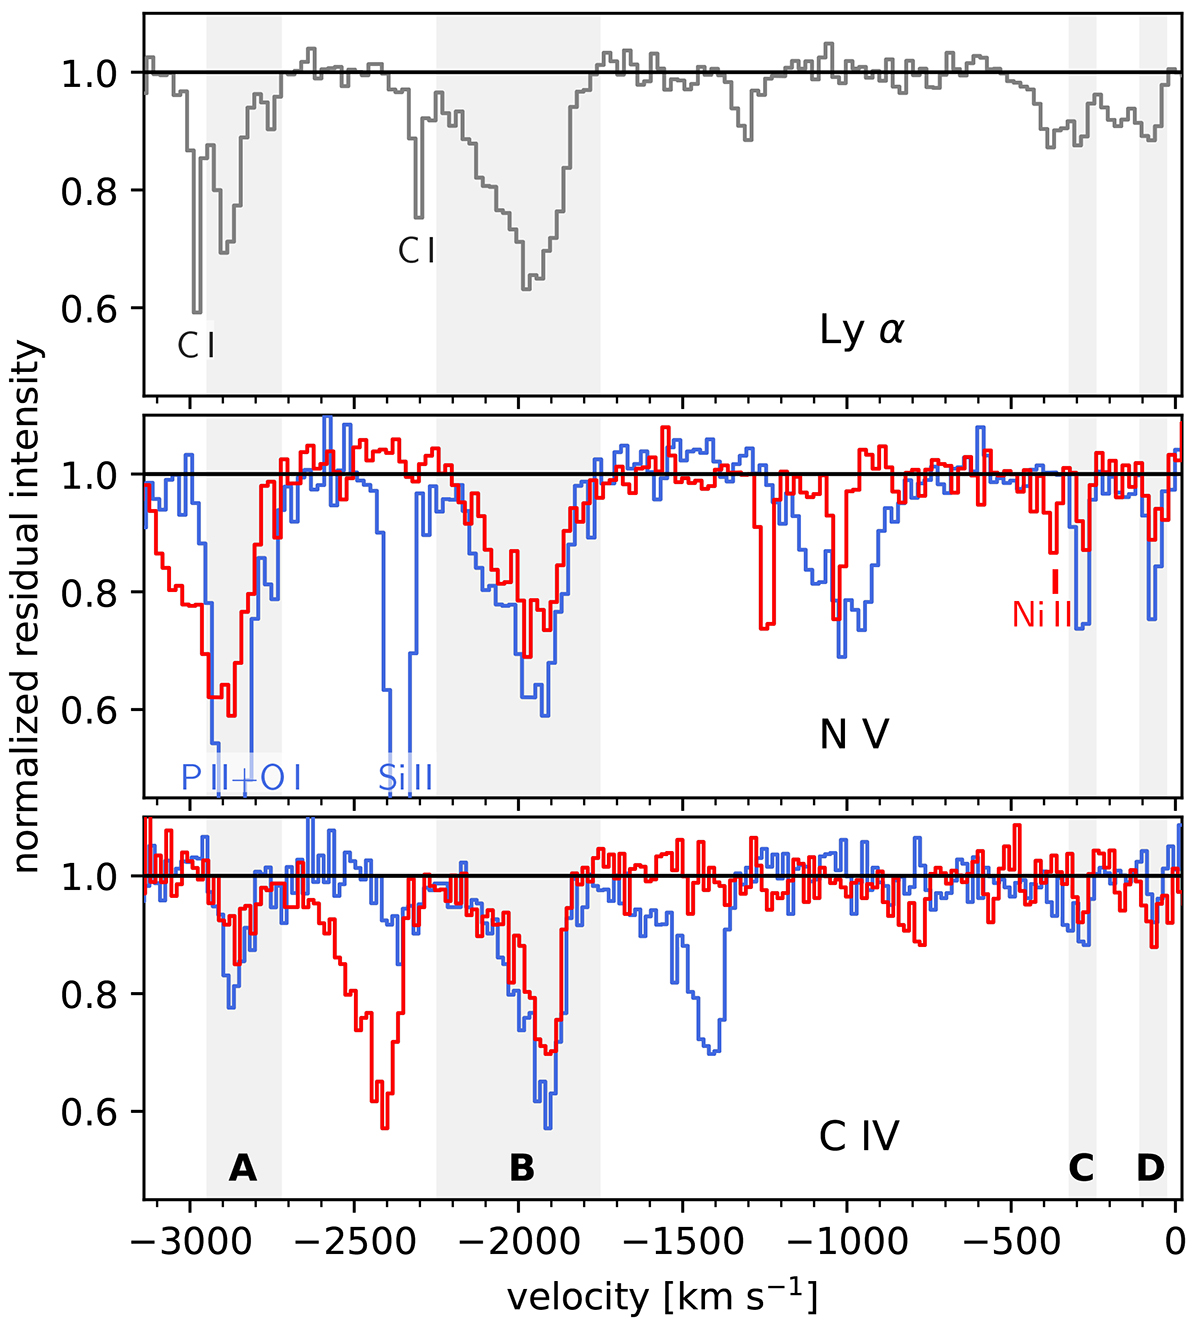
Absorption features in I Zw 1. Normalised residual intensities are plotted as a function of velocity relative to the systemic redshift of z = 0.061169. Unless identified as ISM lines (labelled), the absorption features are assumed to belong to the displayed line: Lyαλ1215 in the top panel, N Vλ1238 (blue) and λ1242 (red) in the middle panel, and C IVλ1548 (blue) and λ1550 (red) in the bottom panel. The four absorption systems that appear in at least two transitions are marked with the shaded areas for clarity and labelled in the bottom panel as A, B, C, and D and discussed in the text.
Current usage metrics show cumulative count of Article Views (full-text article views including HTML views, PDF and ePub downloads, according to the available data) and Abstracts Views on Vision4Press platform.
Data correspond to usage on the plateform after 2015. The current usage metrics is available 48-96 hours after online publication and is updated daily on week days.
Initial download of the metrics may take a while.