Fig. 3.
Download original image
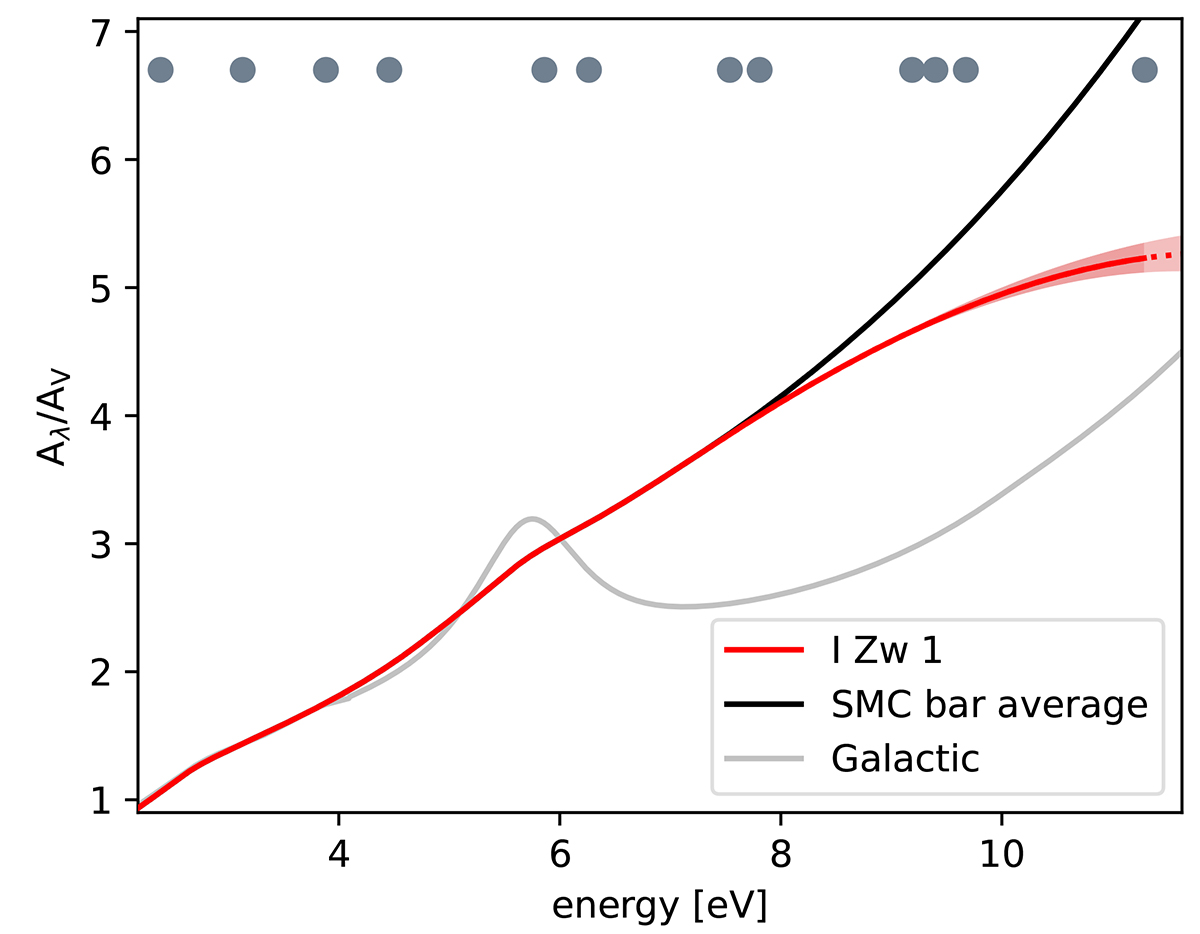
Extinction in I Zw 1 derived from the COS and OM 2015 data. The extinction curve (red line) is based on the Gordon et al. (2003) SMC bar average curve (black). The relatively smaller amount of reddening above 8 eV is described by an additional parameter controlling the far-UV curvature, constrained from the fit to c4 = −0.34 ± 0.05 (see the text for more details). This 1σ uncertainty is visualised with the shaded area surrounding the curve. The Fitzpatrick (1999) Galactic extinction curve (grey) is given for reference. The positions of the data points used for the fitting are depicted with grey dots on the top.
Current usage metrics show cumulative count of Article Views (full-text article views including HTML views, PDF and ePub downloads, according to the available data) and Abstracts Views on Vision4Press platform.
Data correspond to usage on the plateform after 2015. The current usage metrics is available 48-96 hours after online publication and is updated daily on week days.
Initial download of the metrics may take a while.