Fig. 2.
Download original image
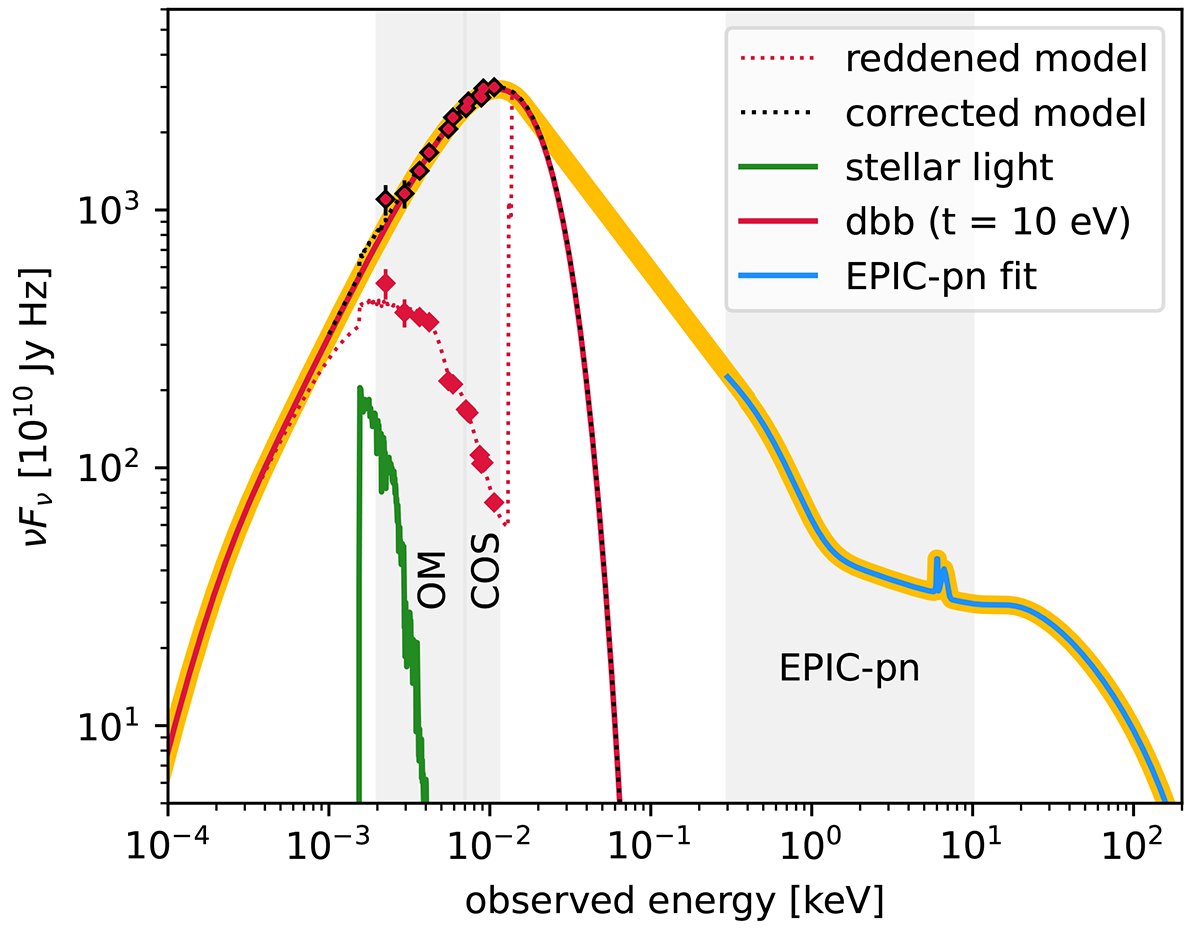
Spectral energy distribution of I Zw 1 derived from the 2015 broadband observations. The best-fitting model (dotted red line) of the UV and optical data points (red diamonds) consists of a disc black body (solid red line), a stellar light component (green line), and a custom extinction curve. The reddening-corrected data and model are shown as well. The disc black body component is connected to the continuum model of the EPIC-pn spectrum (Rogantini et al. 2022, blue line) to form the SED (yellow curve). The observationally covered bands are depicted with the grey-shaded areas.
Current usage metrics show cumulative count of Article Views (full-text article views including HTML views, PDF and ePub downloads, according to the available data) and Abstracts Views on Vision4Press platform.
Data correspond to usage on the plateform after 2015. The current usage metrics is available 48-96 hours after online publication and is updated daily on week days.
Initial download of the metrics may take a while.