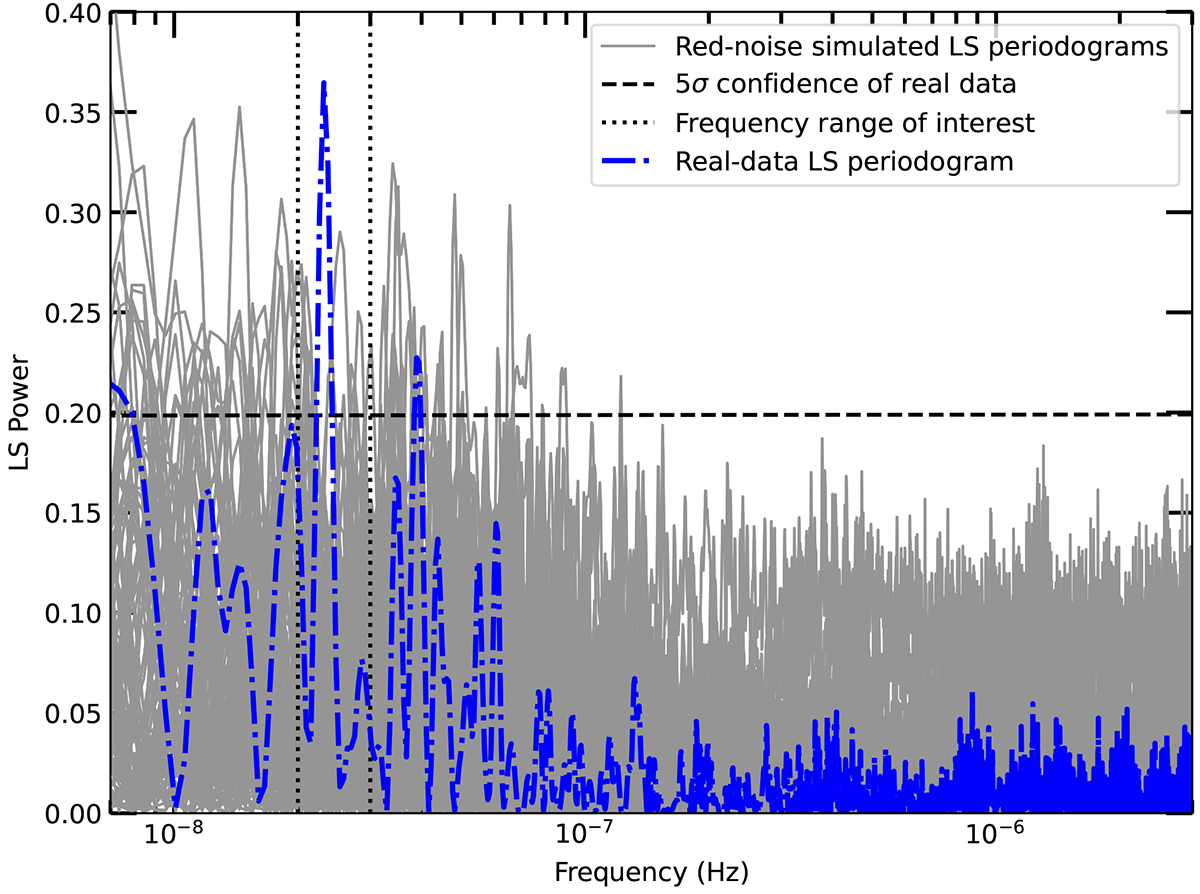
Fig. 6.
Download original image
LS periodograms calculated on randomly generated LCs of pure red noise. For plotting purposes, we show 102 (gray solid lines) out of the total 105 realizations, superimposed on the LS periodogram of the real PG 1553+113 X-ray data (blue dot-dashed line) and the corresponding 5σ significance level (black dashed line; see Sect. 4). The relevant frequency interval for our analysis of (2 − 3)×10−8 Hz (black dotted lines) is also highlighted.
Current usage metrics show cumulative count of Article Views (full-text article views including HTML views, PDF and ePub downloads, according to the available data) and Abstracts Views on Vision4Press platform.
Data correspond to usage on the plateform after 2015. The current usage metrics is available 48-96 hours after online publication and is updated daily on week days.
Initial download of the metrics may take a while.