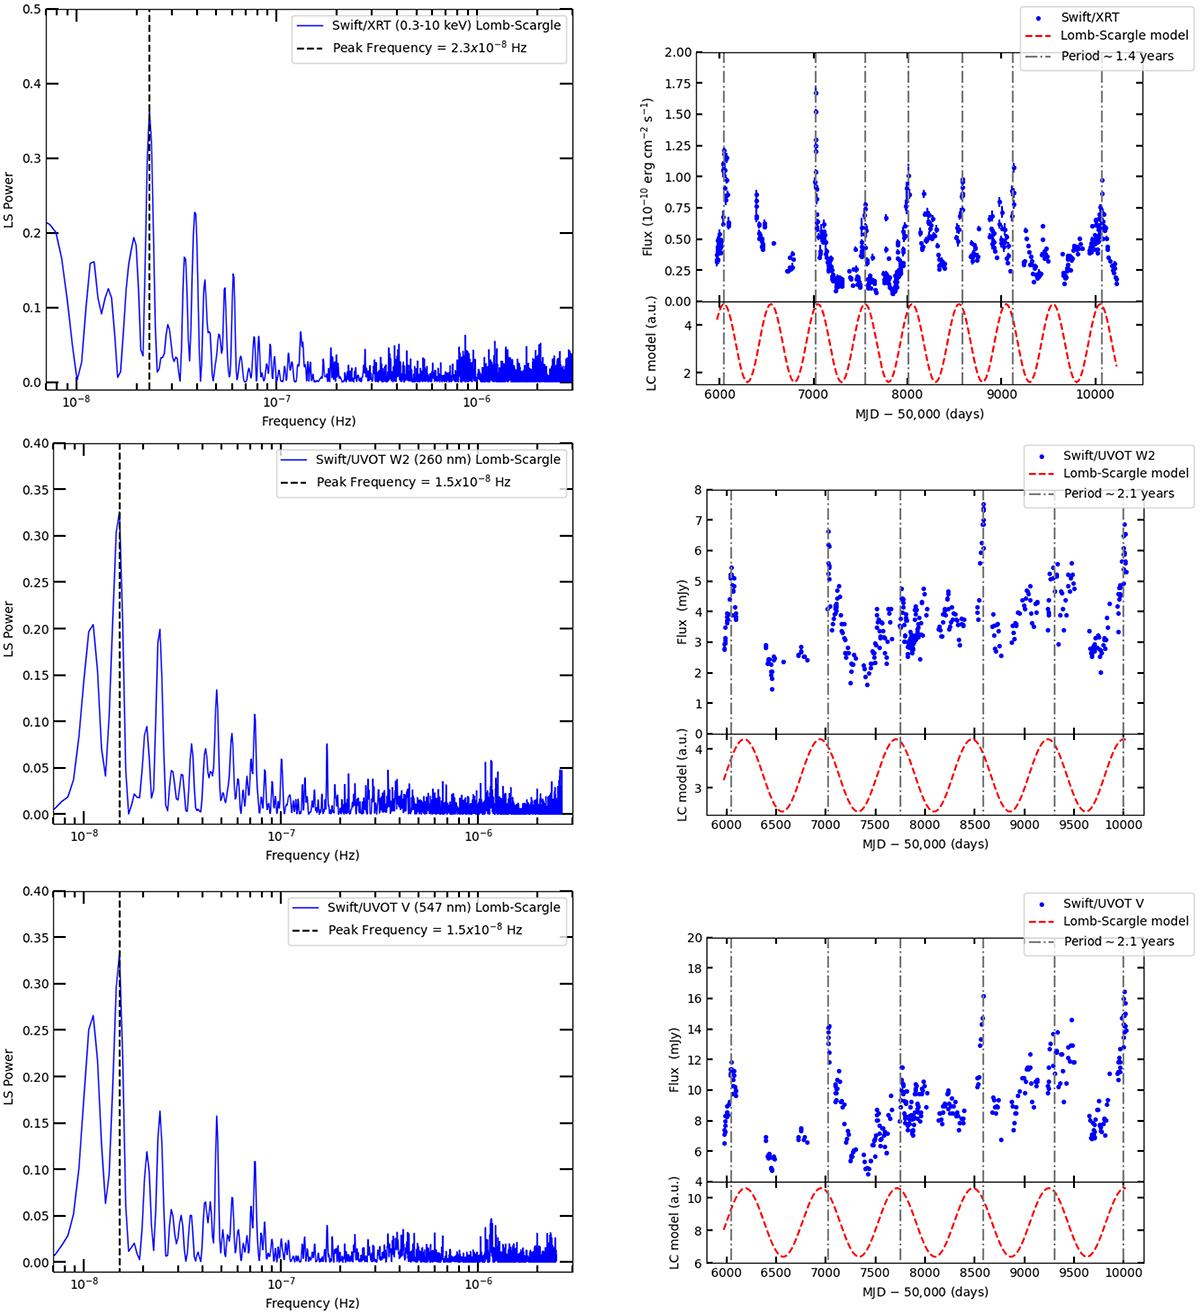
Fig. 4.
Download original image
LS periodograms associated with the corresponding MWL LCs of PG 1553+113. Left panels: PG 1553+113 LS periodograms of X-ray, UV (W2), and optical bands (V; blue solid lines). In each panel, the frequency of the main peak (black dashed line) is highlighted and its value is reported (see legend). Right panels: X-ray, UV, and optical LCs (blue points), along with the relative sinusoids of periods corresponding to the LS most significant frequencies (red dashed lines). In such panels, the sinusoid maxima approximately coinciding with flux peaks in the LCs (gray dot-dashed lines) are marked, and the corresponding period is reported (see legend).
Current usage metrics show cumulative count of Article Views (full-text article views including HTML views, PDF and ePub downloads, according to the available data) and Abstracts Views on Vision4Press platform.
Data correspond to usage on the plateform after 2015. The current usage metrics is available 48-96 hours after online publication and is updated daily on week days.
Initial download of the metrics may take a while.