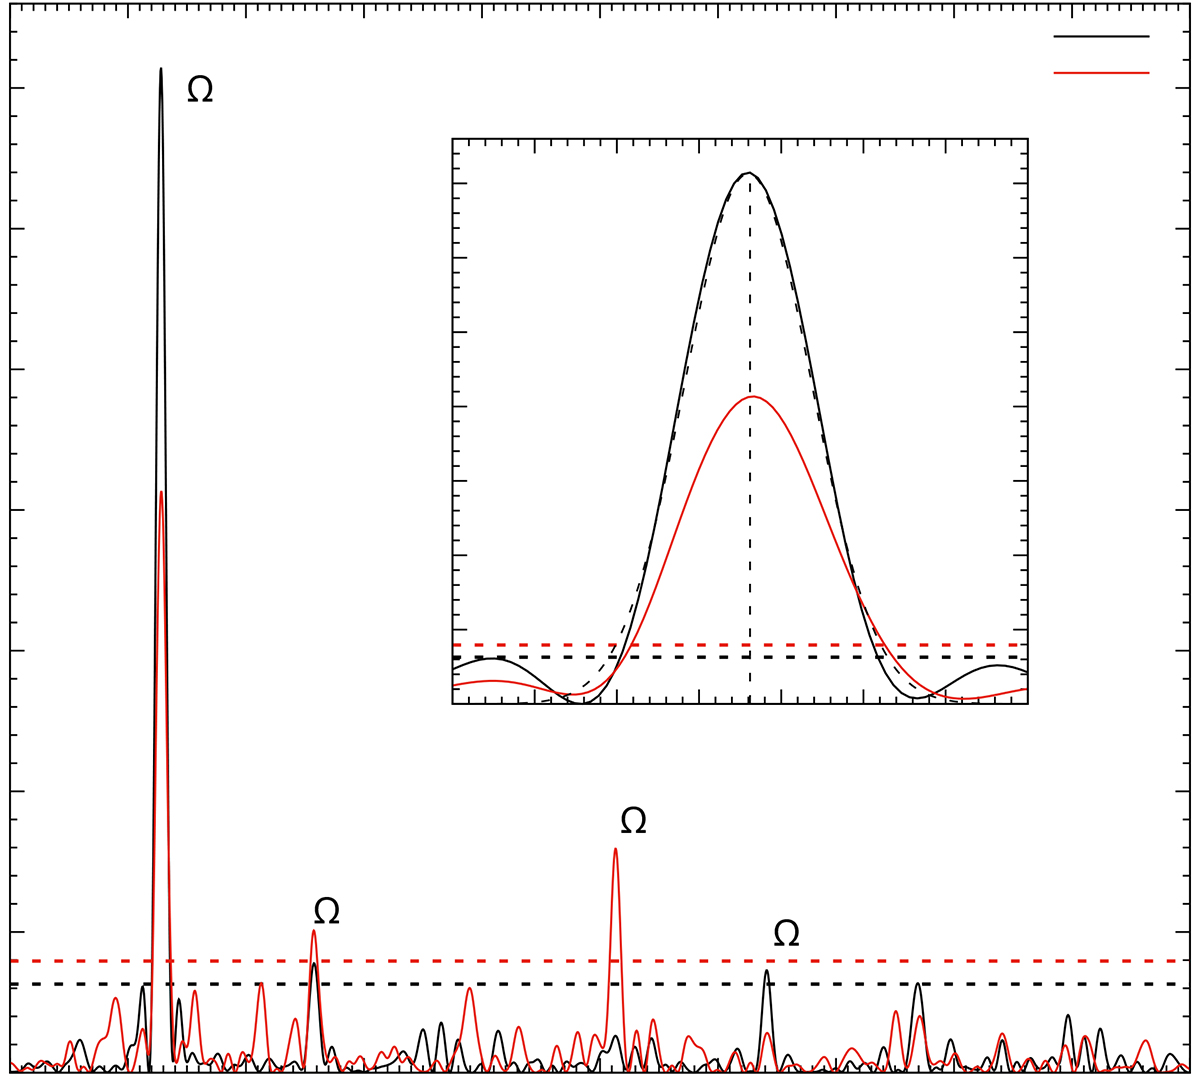
Fig. 5.
Download original image
Power spectrum of XMM152737. The spectrum was obtained from two different observations. The main panel shows the power spectrum of the object obtained by XMM-Newton at 0.2−10 keV with 50 s time bins; these are over plotted together with an inset detailing the main peak. The dashed black line shows a Gaussian line fit to the main peak of observation number 0884991701. The black (Obs 1-0884991701) and red (Obs 2-0886210801) dashed lines in the main panel give the 95% significance level of both observations. The main period and its harmonics are indicated with the Ω symbol.
Current usage metrics show cumulative count of Article Views (full-text article views including HTML views, PDF and ePub downloads, according to the available data) and Abstracts Views on Vision4Press platform.
Data correspond to usage on the plateform after 2015. The current usage metrics is available 48-96 hours after online publication and is updated daily on week days.
Initial download of the metrics may take a while.