Open Access
Fig. 3.
Download original image
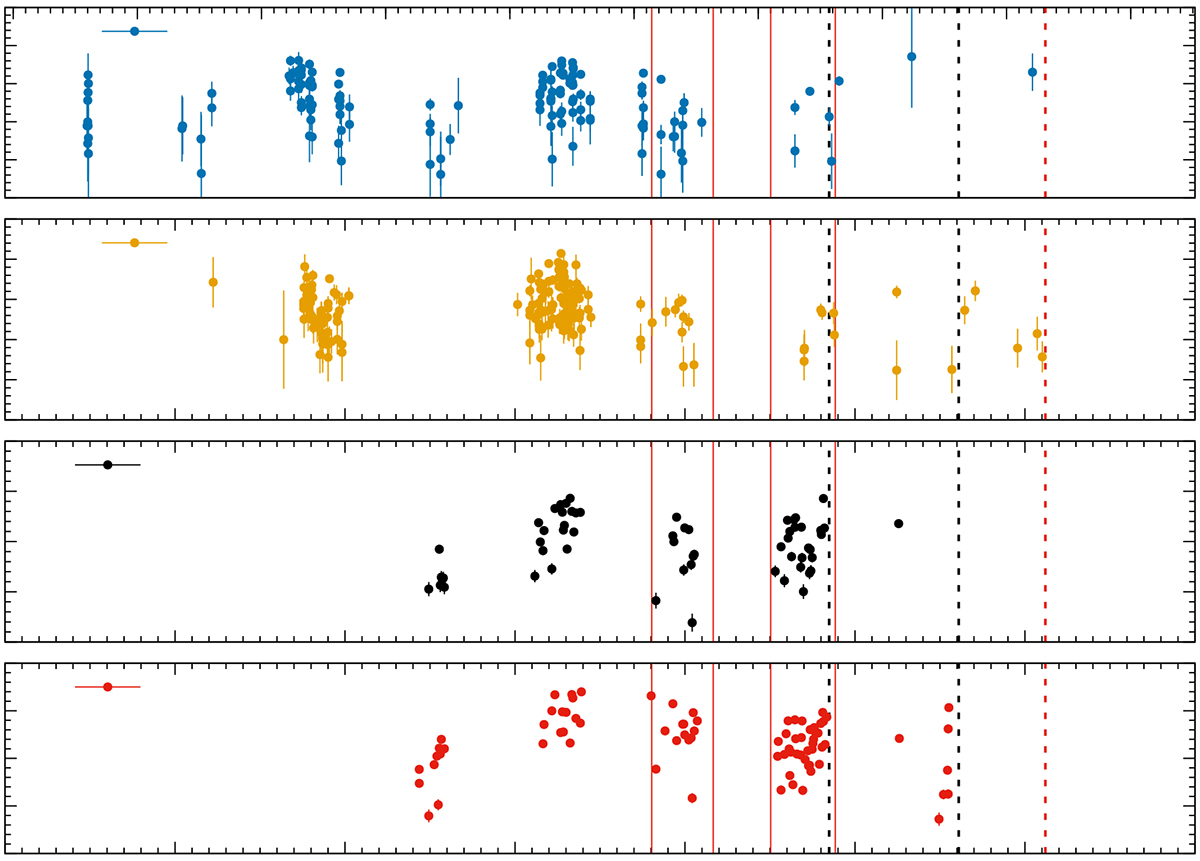
Long-term optical light curve of XMM152737, which corresponds to ATLAS and ZTF observations. The vertical black dashed lines show when the XMM-Newton observation occurred. The red dashed line shows the SALT observation. The vertical solid red lines show eROSITA All Sky Survey observations obtained at 6 month intervals.
Current usage metrics show cumulative count of Article Views (full-text article views including HTML views, PDF and ePub downloads, according to the available data) and Abstracts Views on Vision4Press platform.
Data correspond to usage on the plateform after 2015. The current usage metrics is available 48-96 hours after online publication and is updated daily on week days.
Initial download of the metrics may take a while.