Open Access
Fig. 12.
Download original image
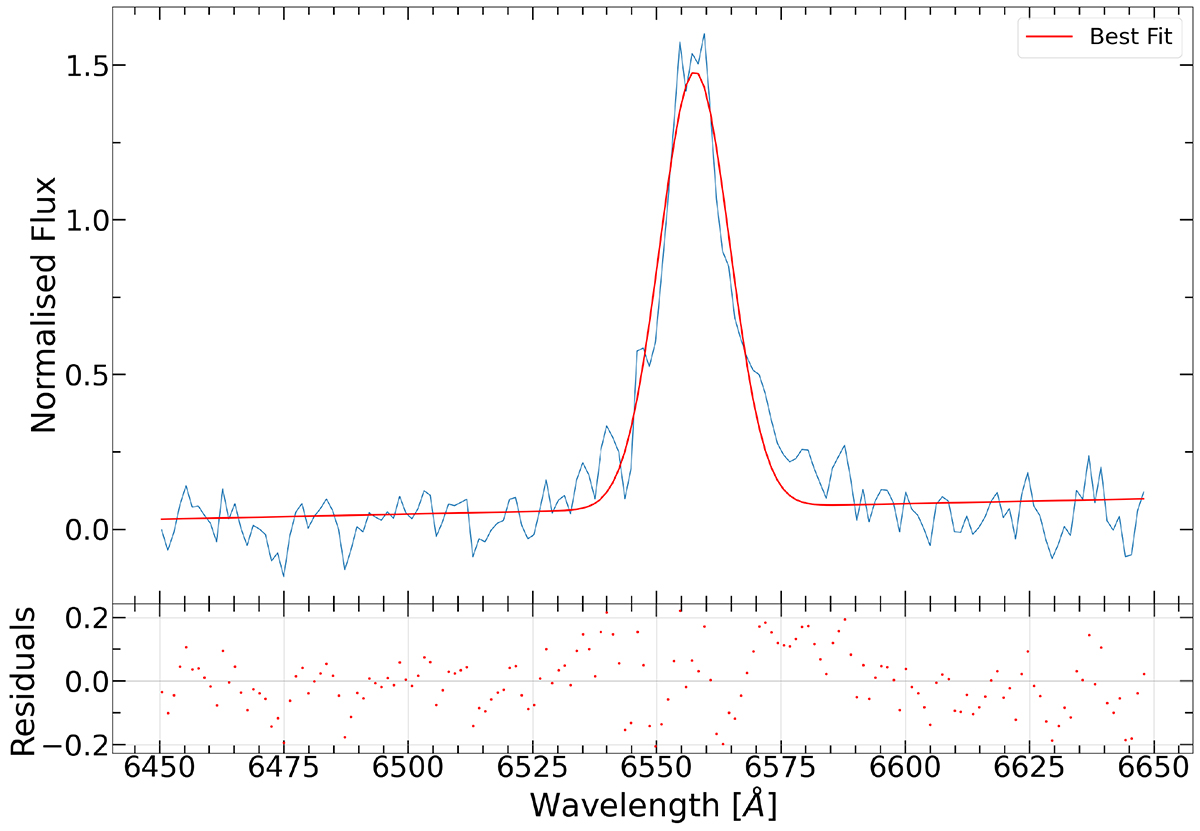
lmfit model fit to the spectral region around the Hα emission line. The fit consists of a straight line approximating the continuum and a Gaussian for the line itself. Shown is the two-component fit with a red line and the data in blue in the upper panel, while the bottom panel shows the residuals of the fit.
Current usage metrics show cumulative count of Article Views (full-text article views including HTML views, PDF and ePub downloads, according to the available data) and Abstracts Views on Vision4Press platform.
Data correspond to usage on the plateform after 2015. The current usage metrics is available 48-96 hours after online publication and is updated daily on week days.
Initial download of the metrics may take a while.