Fig. A.1
Download original image
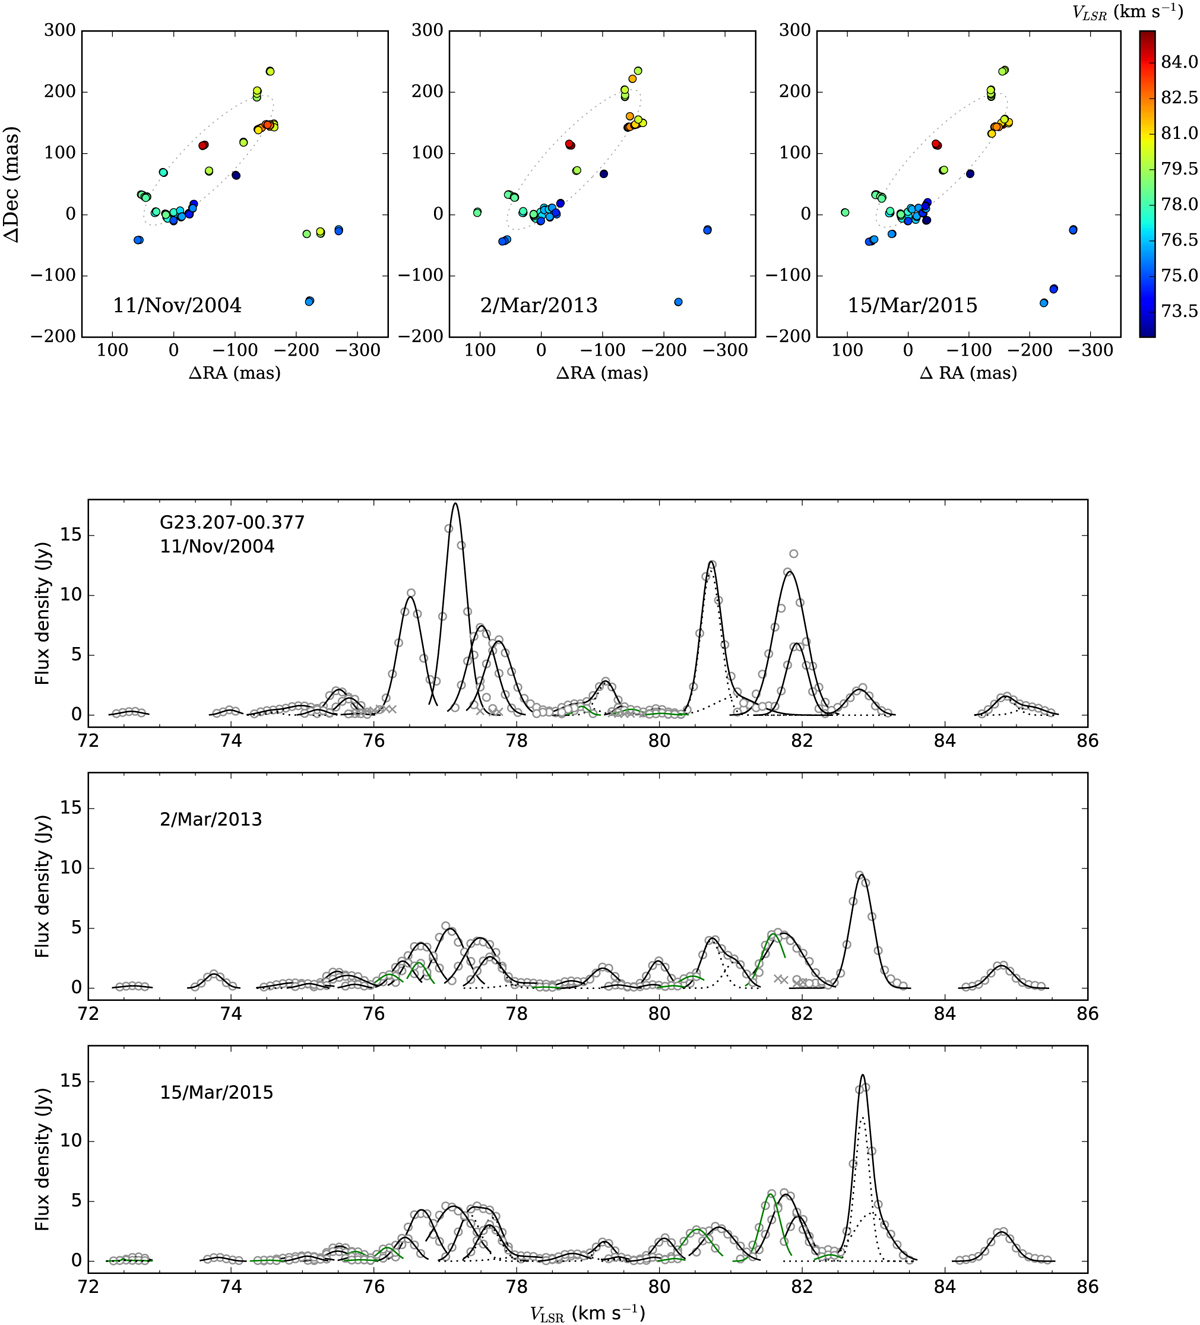
Methanol maser emission at 6.7 GHz detected using the EVN towards G23.207−00.377. Top: Distribution of maser spots in each epoch. The name corresponds to the Galactic coordinates of the brightest spots listed in Table 1, the (0,0) locations. The colours of the circles relate to the LSR velocities as shown on the right bar. The dotted ellipses trace the best fits to all spots detected at each epoch (Table 2). Bottom: Spectra of individual 6.7 GHz maser cloudlets with Gaussian velocity profiles. Each circle traces the emission of a single maser spot, while the lines represent the fitted Gaussian profiles. In cases with a complex profile, we also draw the single Gaussian profiles, denoted by the dotted lines. The cloudlets used for the proper motion studies are marked by the black fitting lines, and they are characterised in Table A.1. The green lines trace the remaining cloudlets with their Gaussian profiles, while crosses correspond to spots from cloudlets without Gaussian characteristics.
Current usage metrics show cumulative count of Article Views (full-text article views including HTML views, PDF and ePub downloads, according to the available data) and Abstracts Views on Vision4Press platform.
Data correspond to usage on the plateform after 2015. The current usage metrics is available 48-96 hours after online publication and is updated daily on week days.
Initial download of the metrics may take a while.