Open Access
Fig. 6
Download original image
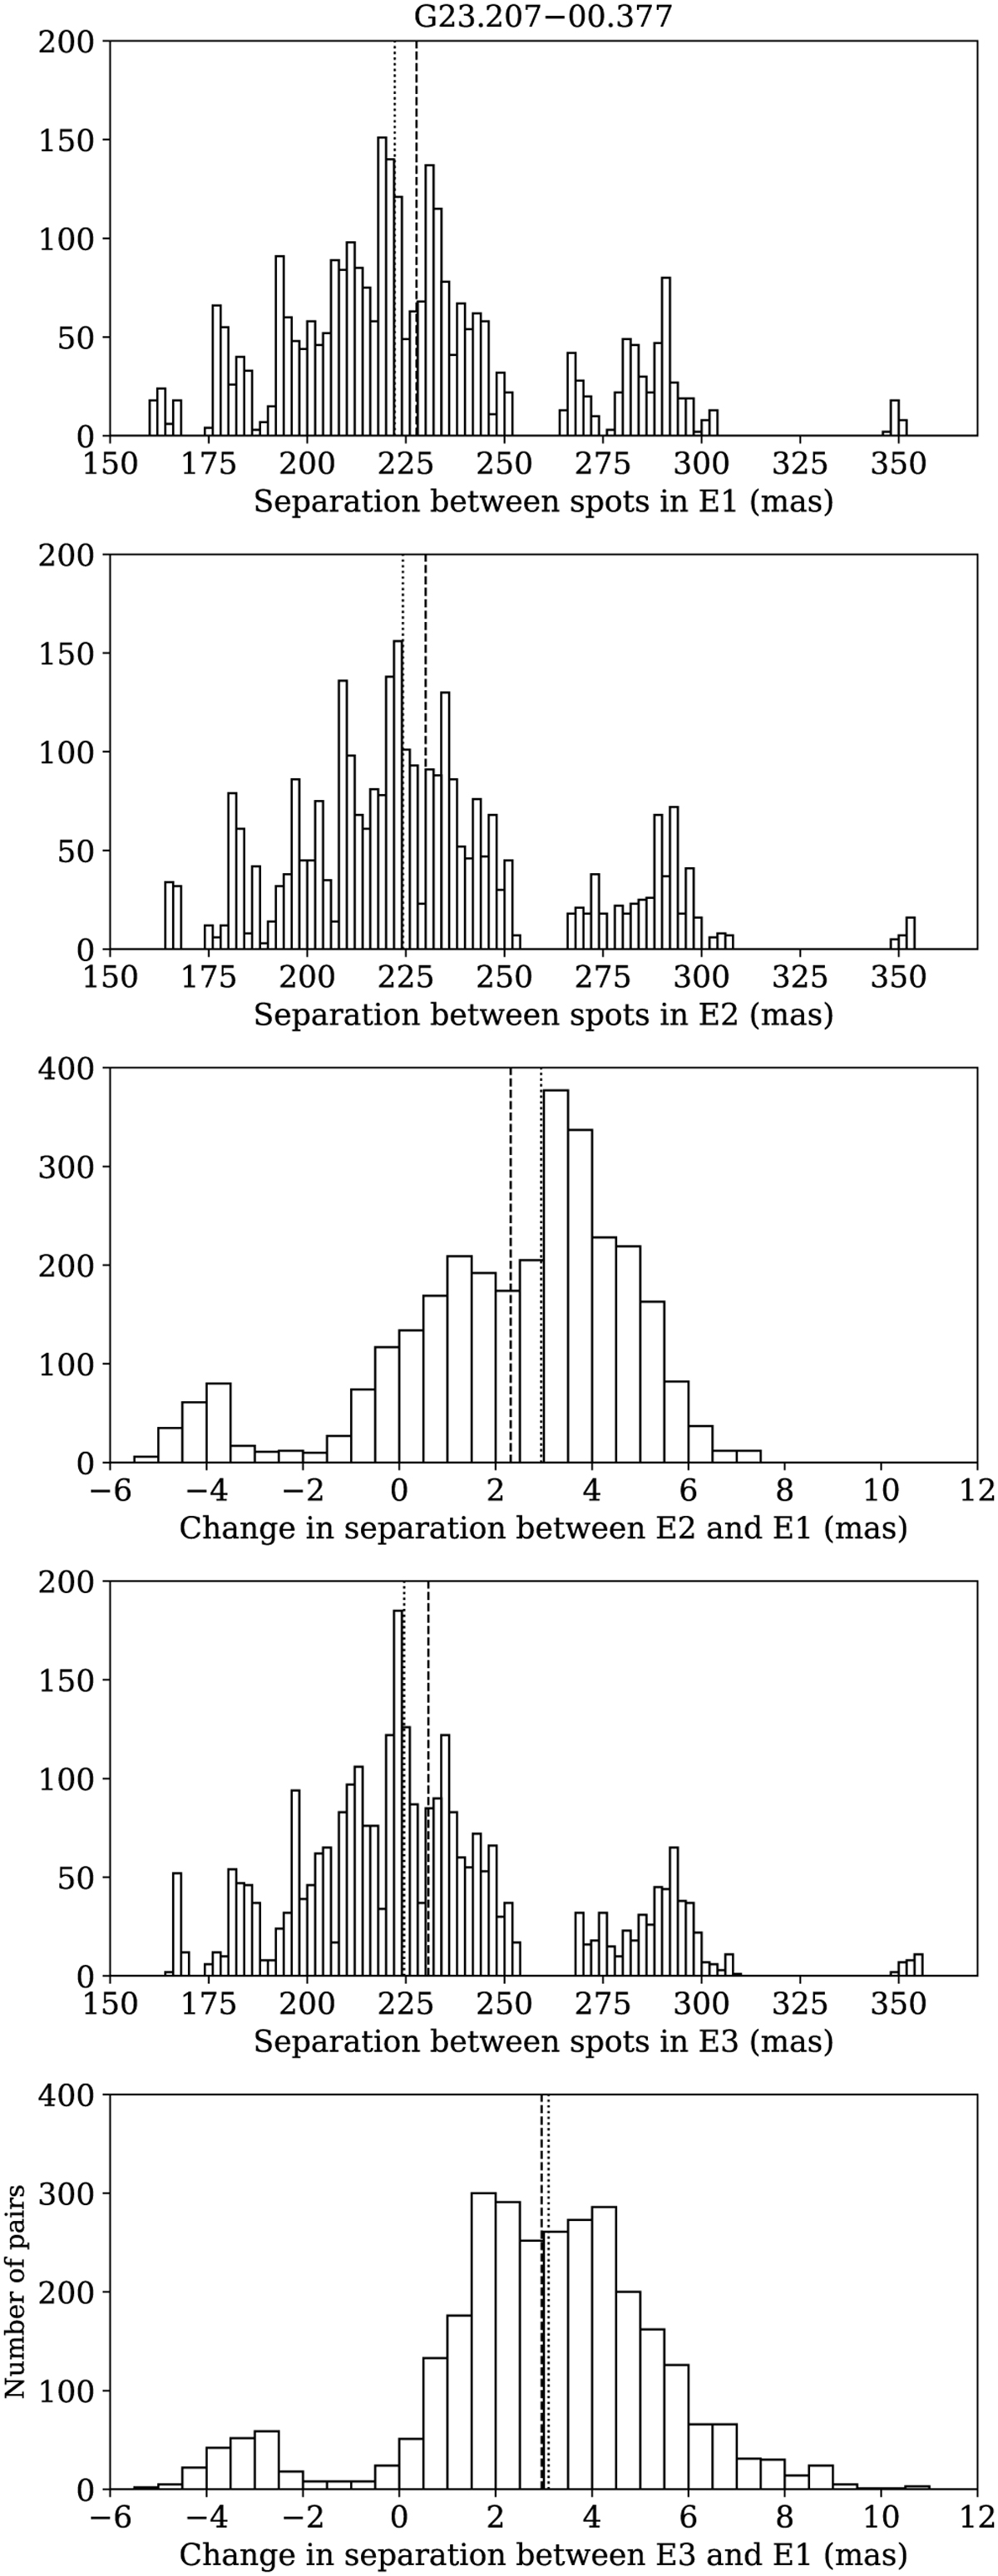
Histograms of separations between SE and NW maser spot pairs in each epoch and the separation increase between epochs E2 and E3 relative to E1 in G23.207−00.377. The dashed lines mark the mean histogram values, while the dotted lines mark the median values. The histograms for the remaining targets are presented in Fig. A.7.
Current usage metrics show cumulative count of Article Views (full-text article views including HTML views, PDF and ePub downloads, according to the available data) and Abstracts Views on Vision4Press platform.
Data correspond to usage on the plateform after 2015. The current usage metrics is available 48-96 hours after online publication and is updated daily on week days.
Initial download of the metrics may take a while.