Open Access
Fig. 3
Download original image
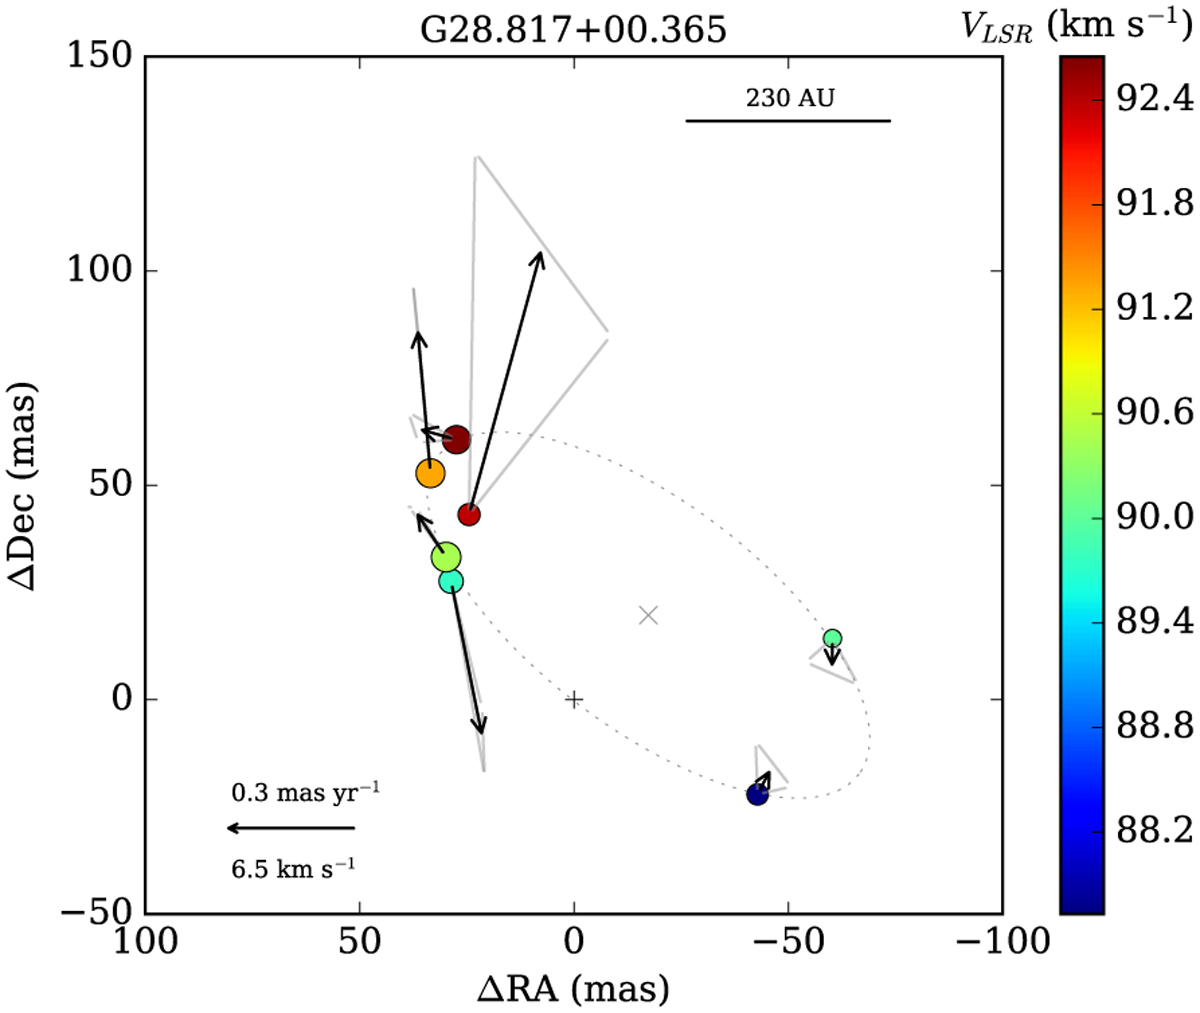
Same as Fig. 1 but for G28.817+00.365. Due to the significantly smaller number of cloudlets, only method 1 was used for the proper motion studies. The centre of motion is marked by the plus sign, the (0,0) point, and it is shifted by (−30.0824 mas, −33.9852 mas) relative to the brightest spots listed in Table 1.
Current usage metrics show cumulative count of Article Views (full-text article views including HTML views, PDF and ePub downloads, according to the available data) and Abstracts Views on Vision4Press platform.
Data correspond to usage on the plateform after 2015. The current usage metrics is available 48-96 hours after online publication and is updated daily on week days.
Initial download of the metrics may take a while.