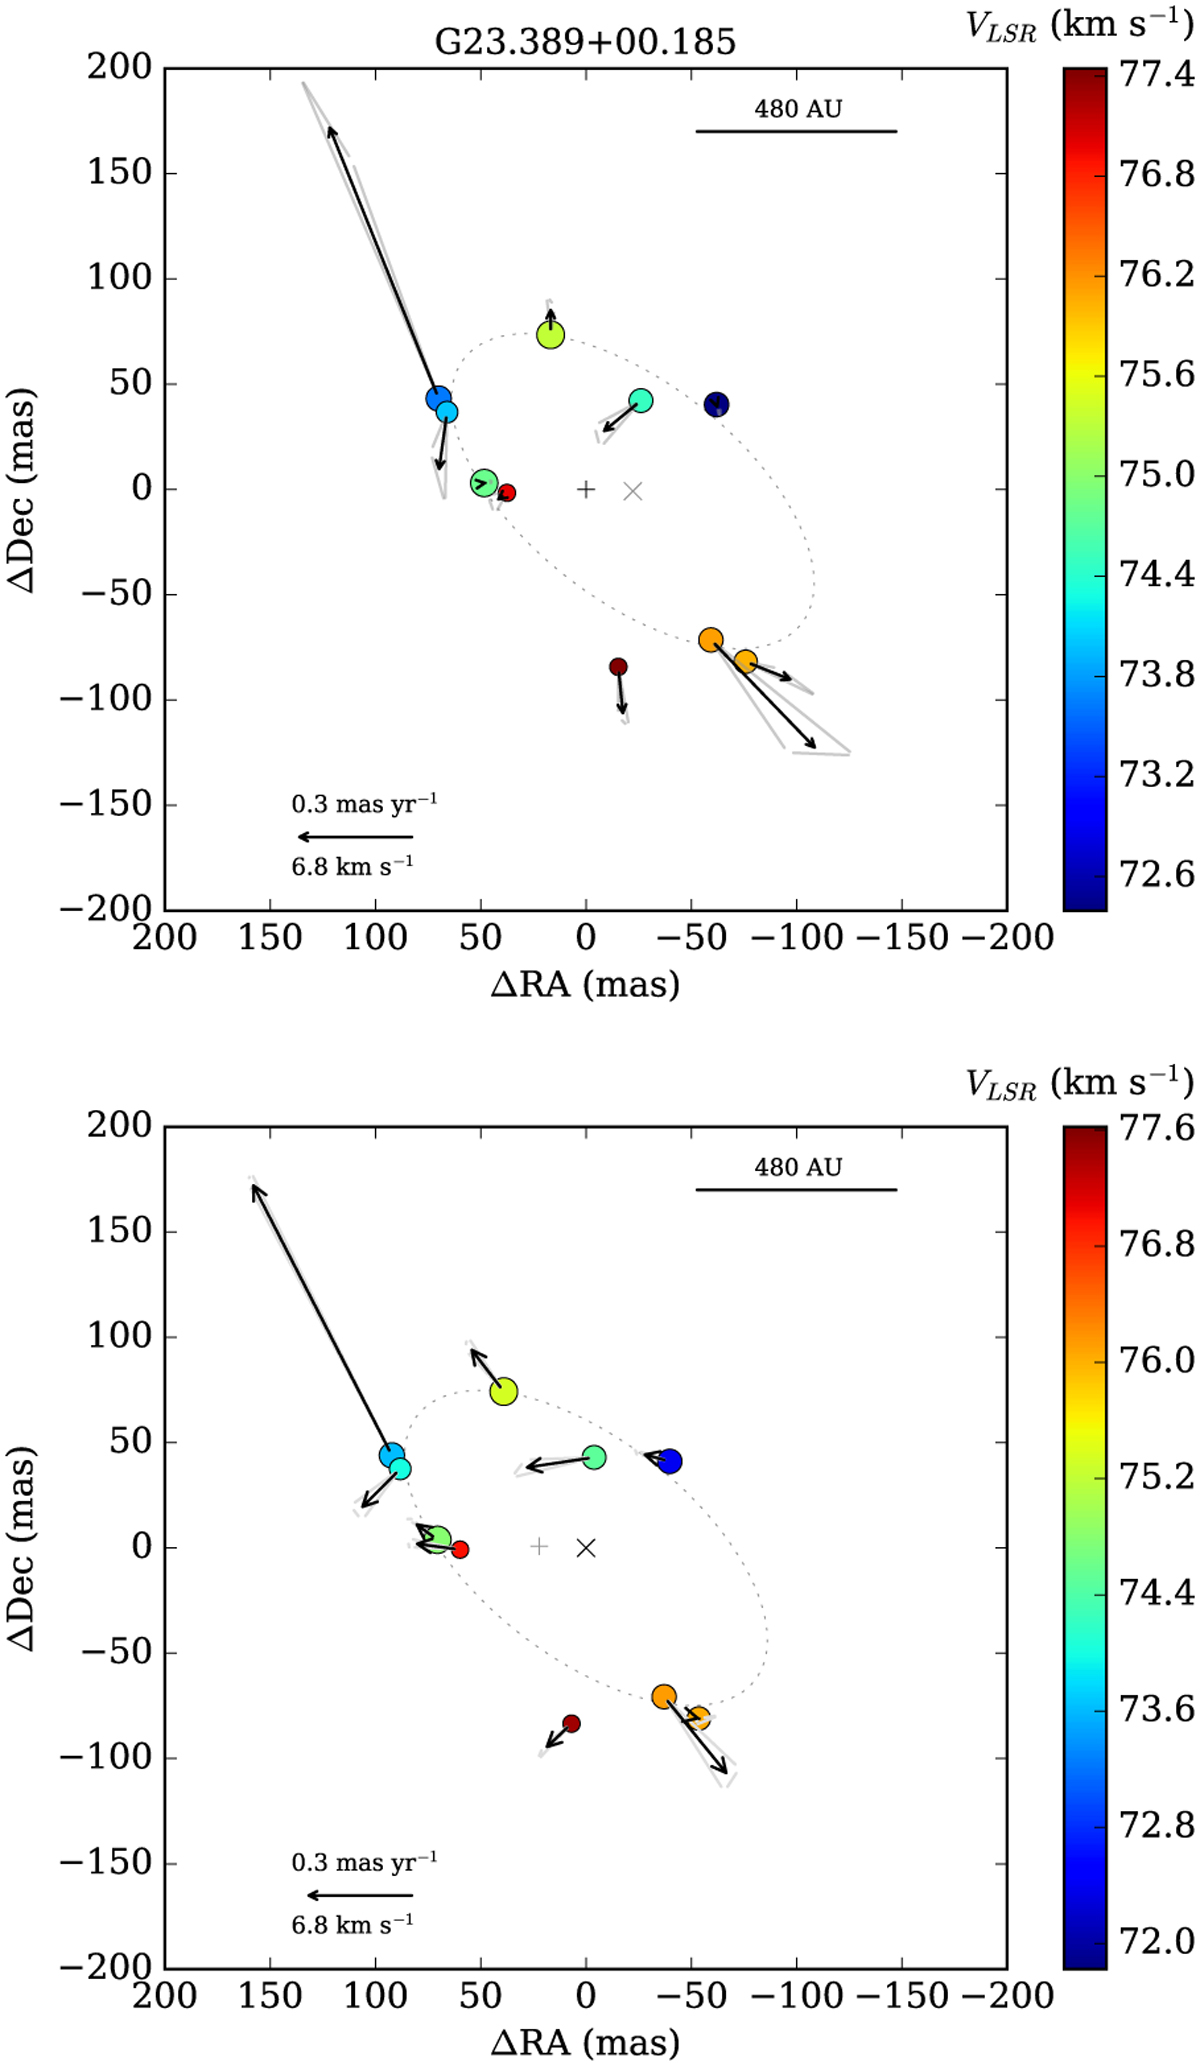
Fig. 2
Download original image
Same as Fig. 1 but for G23.389+00.185. The centre of motion (marked by the plus sign) from method 1, the (0,0) point in the top panel, is shifted by (−16.8016 mas, −73.825 mas) relative to the brightest spots listed in Table 1. The (0,0) point in the bottom panel is defined by the centre of the best-fitted ellipse in E1 (Table 2).
Current usage metrics show cumulative count of Article Views (full-text article views including HTML views, PDF and ePub downloads, according to the available data) and Abstracts Views on Vision4Press platform.
Data correspond to usage on the plateform after 2015. The current usage metrics is available 48-96 hours after online publication and is updated daily on week days.
Initial download of the metrics may take a while.