Fig. A.8
Download original image
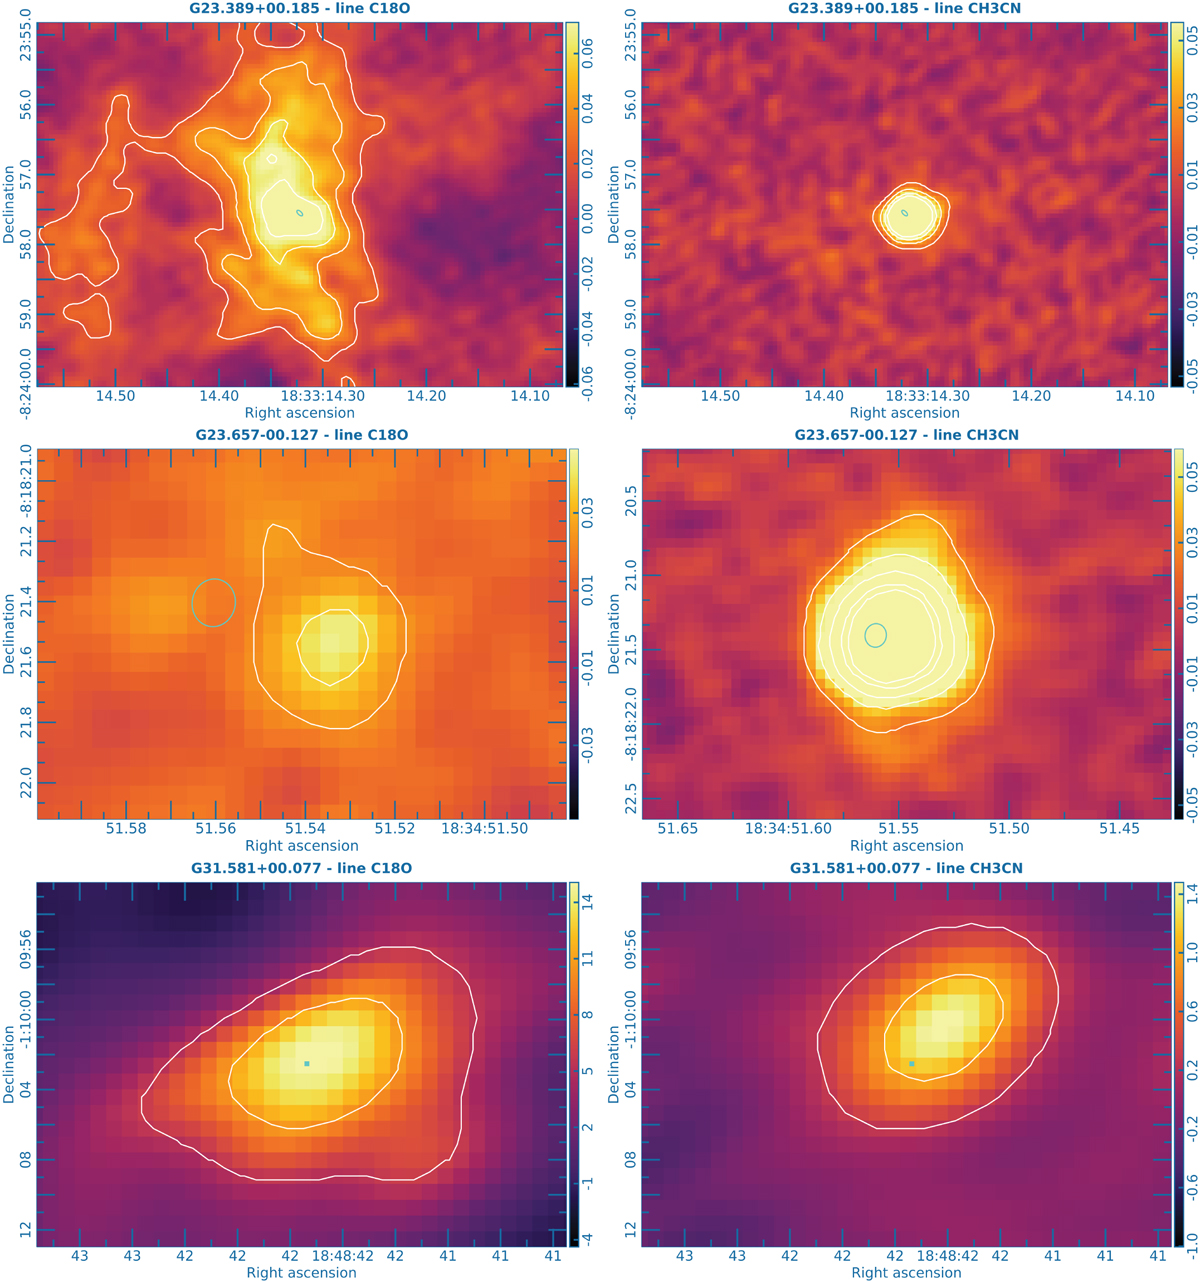
Thermal emission closer to G23.389+00.185 (top panel), G23.657−00.127 (middle panel), and G31.581+00.077 (bottom panel) from the ALMA archive. Data were part of the large programme ALMAGal (ID: 2019.1.00195.L). The methanol emission is presented with the green ellipses. The colourful images correspond to C18O (left) and CH3CN (right) emission for channel maps taken at the line peak.
Current usage metrics show cumulative count of Article Views (full-text article views including HTML views, PDF and ePub downloads, according to the available data) and Abstracts Views on Vision4Press platform.
Data correspond to usage on the plateform after 2015. The current usage metrics is available 48-96 hours after online publication and is updated daily on week days.
Initial download of the metrics may take a while.