Fig. 1
Download original image
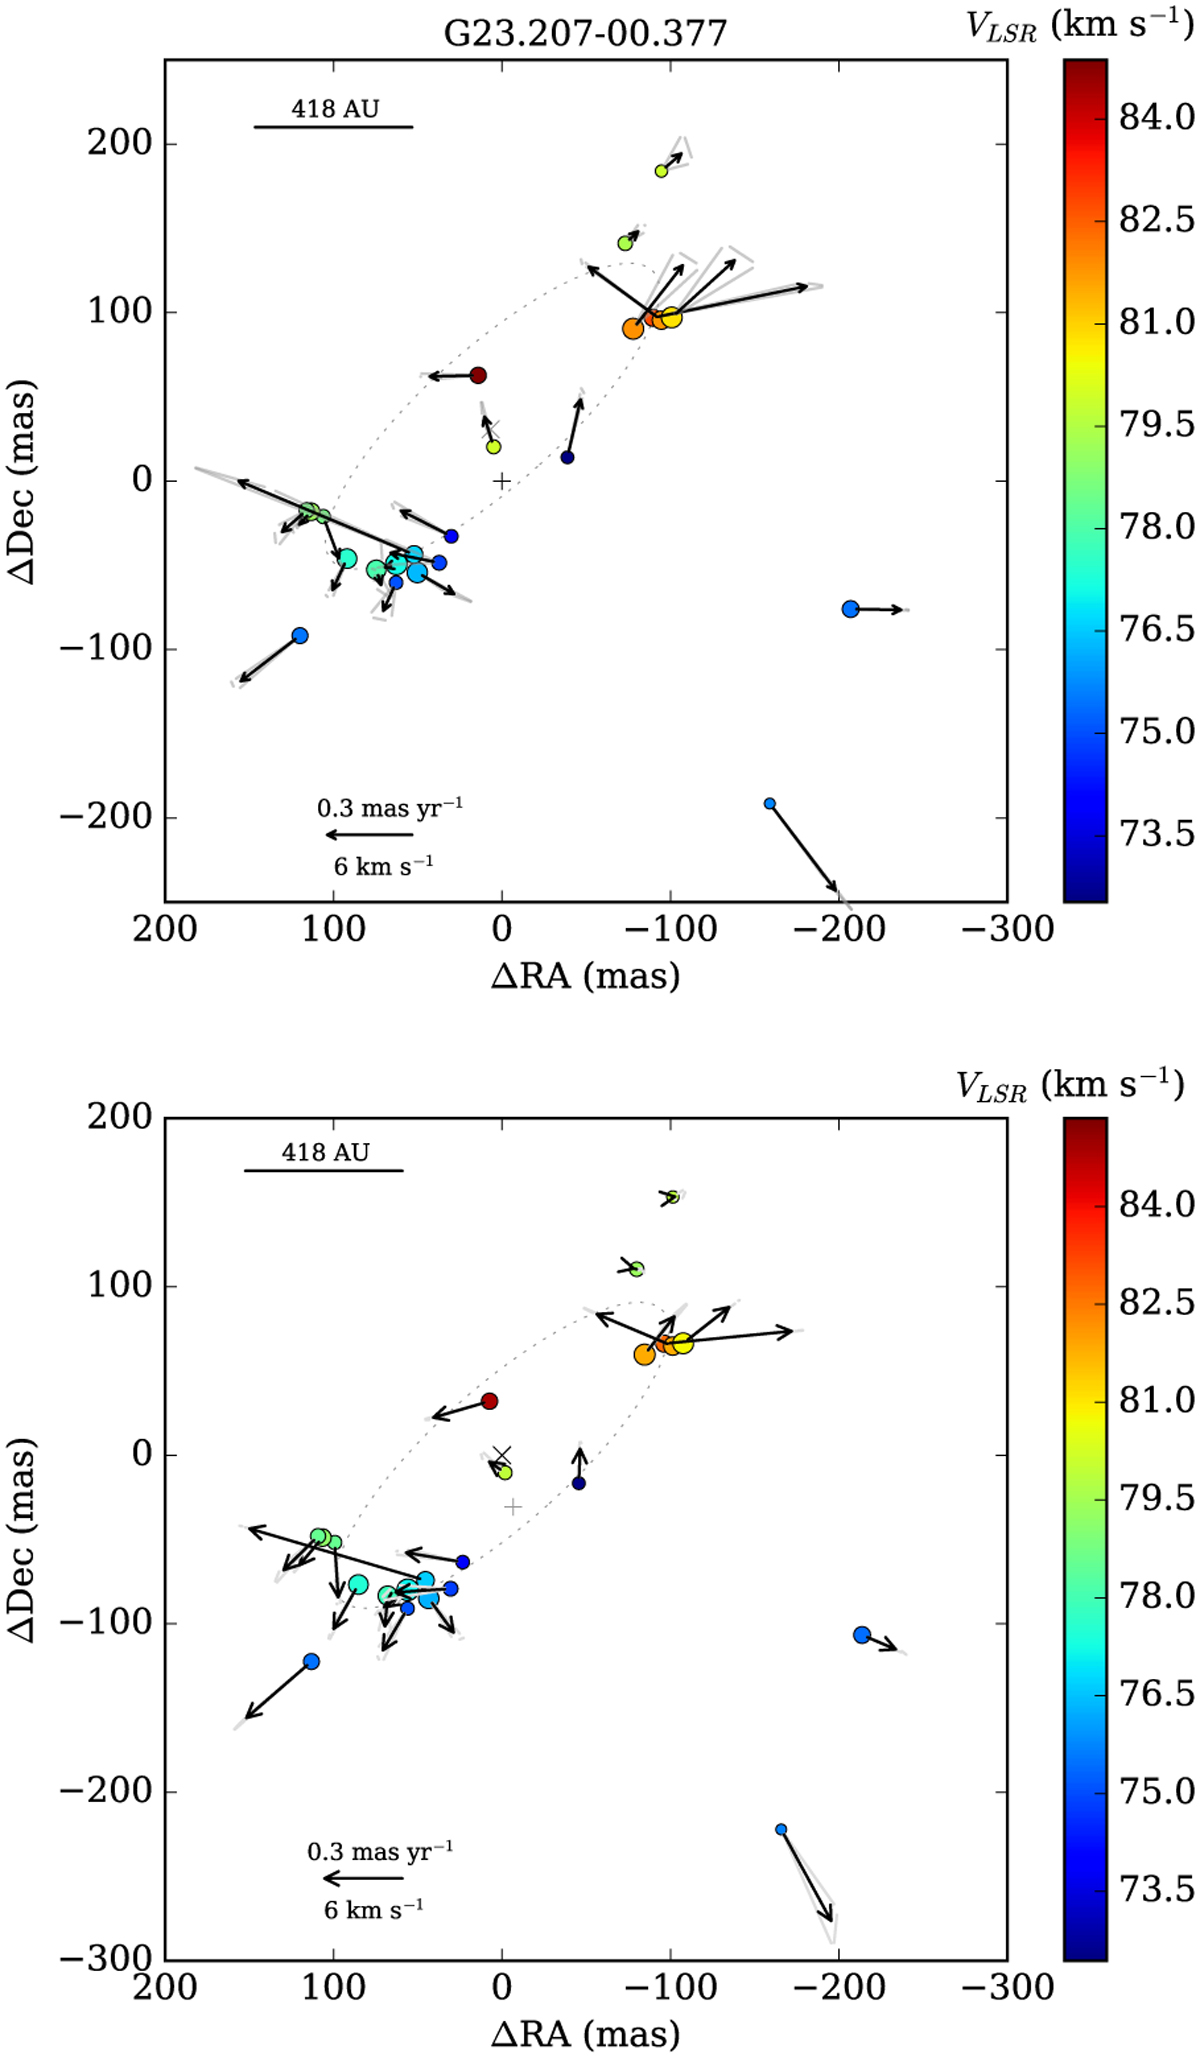
Proper motions of 6.7 GHz methanol maser cloudlets in G23.207−00.377. Top: proper motions as measured relative to the centre of motion. The black arrows indicate the best fits of the relative proper motion over the three-epoch data, and the uncertainties are marked by the grey triangles. The centre of motion is marked by the plus sign and explained in Sect. 2.1 (method 1); the (0,0) point is offset by (−62.59255 mas, 50.5022 mas) relative to the brightest spots listed in Table 1. The circle sizes are proportional to the logarithm of the flux of the brightest maser spots of each cloudlet at epoch E1, and the colours relate to their LSR velocities as shown on the vertical wedge. The dotted ellipse traces the best flux-weighted fit to all cloudlets as detected in E1 (Table 2), and its centre is marked with a cross. Bottom: proper motions estimated using method 2 by fitting the ellipse at each epoch and aligning their centres. The (0,0) point, marked by a cross, corresponds to the centre of the best-fitted ellipse in E1 (Table 2). The black arrows represent the averaged proper motion vectors between E1–E2 and E1–E3 data.
Current usage metrics show cumulative count of Article Views (full-text article views including HTML views, PDF and ePub downloads, according to the available data) and Abstracts Views on Vision4Press platform.
Data correspond to usage on the plateform after 2015. The current usage metrics is available 48-96 hours after online publication and is updated daily on week days.
Initial download of the metrics may take a while.