Fig. 3
Download original image
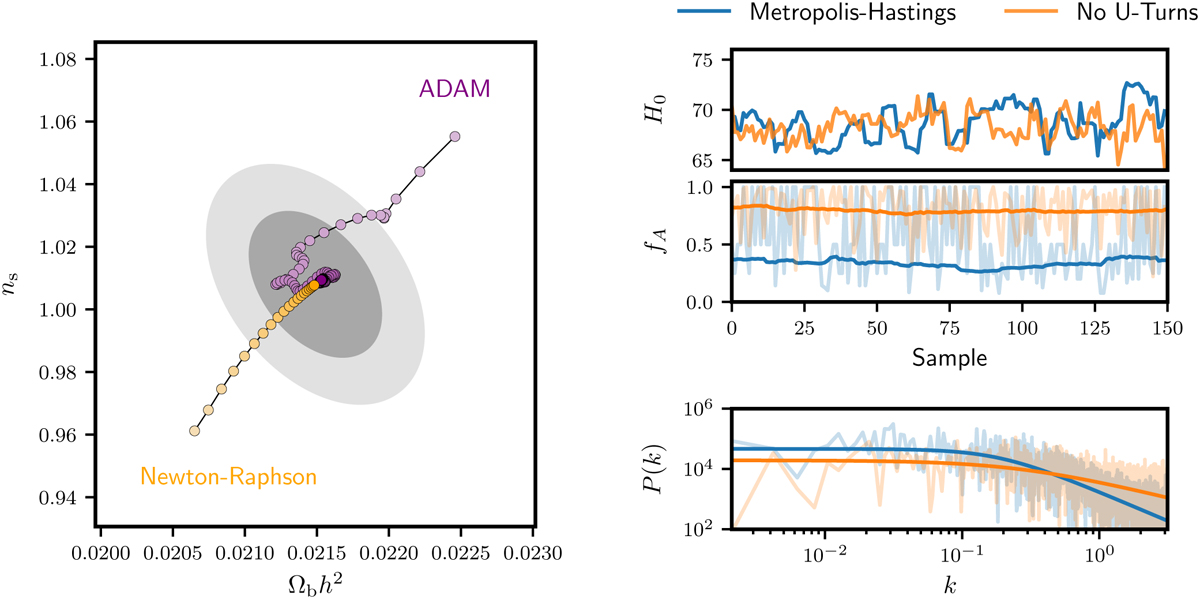
Gradient-based explorations of the ACT DR4 likelihood surface in ΛCDM. Left: Newton-Raphson (orange) and ADAM (purple) minimisers use gradient information to find the best-fit point of the ACT DR4 data set (light to dark points). We highlight steps in the ns − Ωbh2 plane, though the minimisation is performed over all ΛCDM parameters and the calibration parameter of the data set. While the Newton-Raphson algorithm directly descends to the best-fit point, the ADAM minimiser follows a more complicated trajectory with some stochasticity to ensure it does not get trapped in local minima. The grey contours in the background show the 1 and 2σ confidence region obtained from the Hessian, which is a by-product of the Newton-Raphson algorithm. Right: comparison of Metropolis-Hastings (MH; blue) and No-U-Turns (orange) chains run using the ACT DR4 data set in ΛCDM. We focus on H0 samples here, though the MCMC chains explore the full parameter space. The top and middle panels show the H0 values and acceptance rate ƒA (values in faint lines, rolling average over 50 samples in full colour) for an excerpt of 150 samples, respectively. The bottom panel shows the power spectrum P(k) of the H0 samples of the full-length chain (measured spectra in faint lines, parametric fit (Dunkley et al. 2005) in full colour). The NUTS samples are less correlated by eye than the MH samples, which is confirmed by the flatter power spectrum. Additionally, the acceptance rate of the gradient-based algorithm is substantially higher, with few rejected samples.
Current usage metrics show cumulative count of Article Views (full-text article views including HTML views, PDF and ePub downloads, according to the available data) and Abstracts Views on Vision4Press platform.
Data correspond to usage on the plateform after 2015. The current usage metrics is available 48-96 hours after online publication and is updated daily on week days.
Initial download of the metrics may take a while.