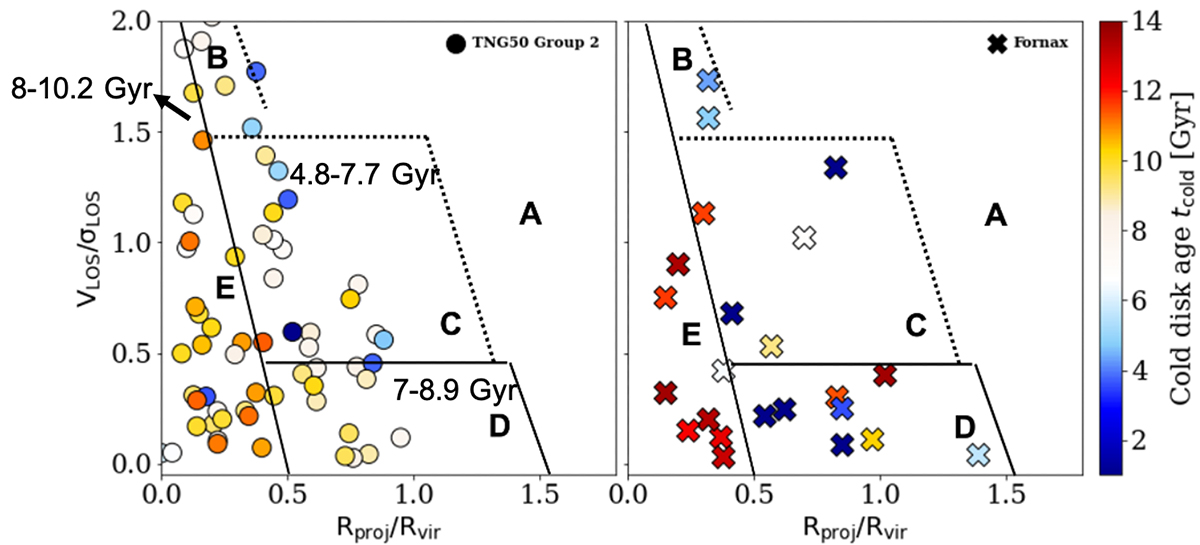
Fig. 9.
Download original image
Distribution of TNG50 and observed cluster galaxies in the phase-space of projected LOS velocity versus projected cluster-centric radius, color coded by the stellar age of the dynamically cold component. In particular, we compare Fornax cluster members (right) to cluster galaxies of the TNG50 halo with Group ID 2 (left), in a random projection. The boundaries of regions A, B, C, D, and E are defined as in Rhee et al. (2017). Both simulated and observed cluster galaxies exhibit similar trends, with galaxies closer to the cluster center typically having older stars in their disk components. The annotated numbers give the 25th–75th percentile ranges of the true infall time of the simulated galaxies in region E, D, and B+C, respectively.
Current usage metrics show cumulative count of Article Views (full-text article views including HTML views, PDF and ePub downloads, according to the available data) and Abstracts Views on Vision4Press platform.
Data correspond to usage on the plateform after 2015. The current usage metrics is available 48-96 hours after online publication and is updated daily on week days.
Initial download of the metrics may take a while.