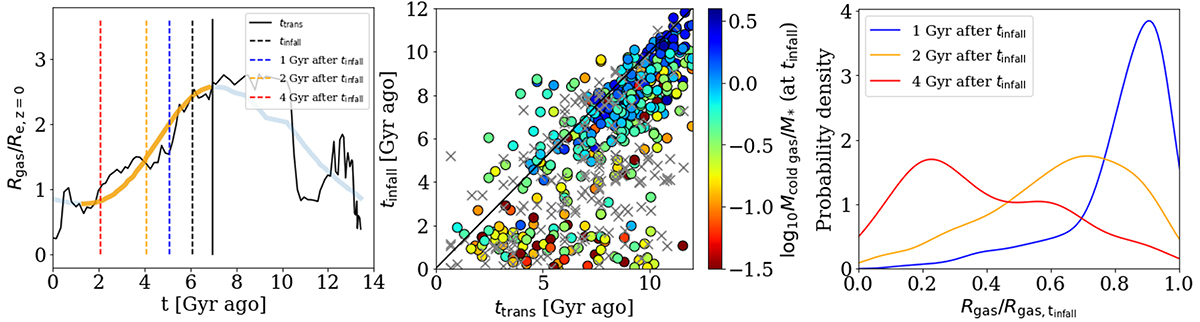
Fig. 5.
Download original image
Reduction in the spatial extent of the star-forming gas in TNG50 cluster satellites after infall. Left: evolution of the SF-weighted gas radius of the example galaxy of the previous figures, as a function of lookback time in gigayears. The black curve represents the outcome along the main progenitor branch of the galaxy; the blue curve represents a Fourier-smoothed version thereof. The yellow curve highlights the time when the gas radius gets smaller. The solid vertical black line represents the time when the gas radius starts to shrink, which we define as ttrans. The dashed black line represents infall, tinfall. The dashed blue, orange, and red lines represent 1 Gyr, 2 Gyr, and 4 Gyr after ttrans, respectively. Middle: relationship between infall time and the time when the gas radius starts to shrink for all selected TNG50 cluster satellites, colored by the mass of star-forming gas at infall. Gray crosses represent preprocessed galaxies. The solid black line represents the one-to-one line. Right: probability density distribution of the gas radius ratio to that at infall for all selected TNG50 galaxies inspected 1, 2, and 4 Gyr after tinfall, respectively.
Current usage metrics show cumulative count of Article Views (full-text article views including HTML views, PDF and ePub downloads, according to the available data) and Abstracts Views on Vision4Press platform.
Data correspond to usage on the plateform after 2015. The current usage metrics is available 48-96 hours after online publication and is updated daily on week days.
Initial download of the metrics may take a while.