Fig. 4.
Download original image
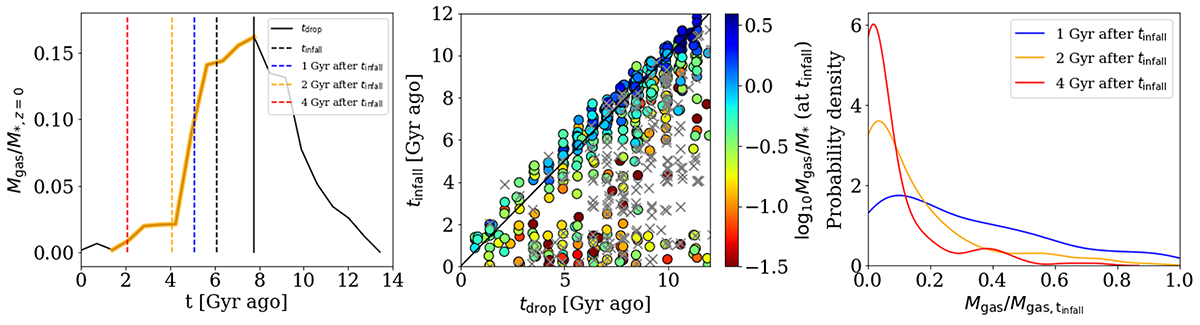
Reduction in star-forming gas mass in TNG50 cluster satellites after infall. Left: evolution of the star-forming gas mass of the example galaxy of Fig. 3 as a function of lookback time in gigayears. The yellow region shows a clear steep drop in the star-forming gas mass. The solid black line represents the starting point of such a gas drop, which we define as tdrop. The dashed black line represents tinfall as defined in Sect. 2.2.2. The dashed blue, orange, and red lines represent 1 Gyr, 2 Gyr, and 4 Gyr after tdrop, respectively. Middle: relationship between the infall time and the gas drop time for all selected TNG50 cluster satellites: each point represents one galaxy, colored by the mass fraction of star-forming gas in the galaxy at infall. Gray crosses represent preprocessed galaxies that are otherwise excluded from our analysis. The solid black line represents the one-to-one line. Right: probability density distribution of the ratio of remaining star-forming gas mass compared to that at infall, for all the selected TNG50 galaxies inspected 1 Gyr (blue), 2 Gyr (orange), and 4 Gyr after tdrop (red).
Current usage metrics show cumulative count of Article Views (full-text article views including HTML views, PDF and ePub downloads, according to the available data) and Abstracts Views on Vision4Press platform.
Data correspond to usage on the plateform after 2015. The current usage metrics is available 48-96 hours after online publication and is updated daily on week days.
Initial download of the metrics may take a while.