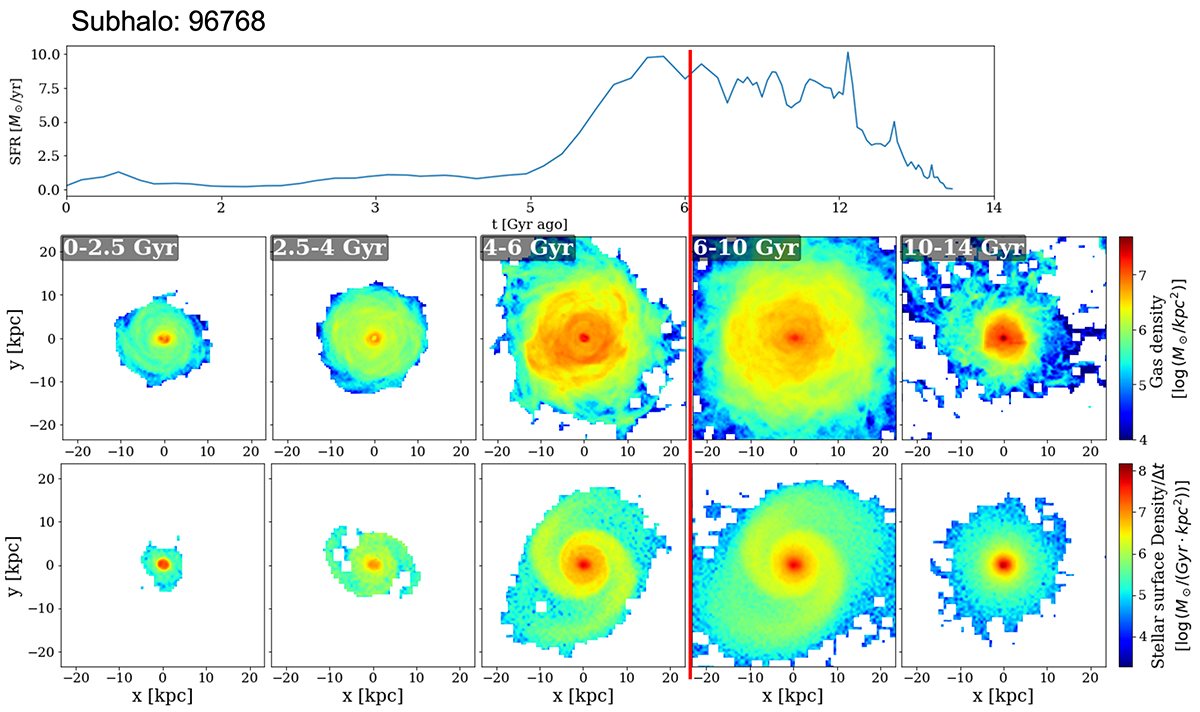
Fig. 3.
Download original image
Evolution of an example cluster galaxy from TNG50 (Subhalo ID 96768 at z = 0). We show the time evolution of the SFR (top panel), the average star-forming gas density (middle panels), and a face-on view of the average stellar surface density (bottom panels) of this galaxy that at z = 0 has 1010.5 M⊙ in stars and is a satellite of a cluster of 1013.8 M⊙ in total mass. For the average stellar surface density, we do not show the property of the galaxy at the various epochs, but rather the stellar distribution in different age bins, from left to right and normalized by the length of age interval in each bin; the maps are obtained from all stars that are gravitationally bound according to SUBFIND at z = 0 and within 6 Re. The star-forming gas density is measured by averaging all star-forming gas cells of all snapshots in the corresponding time bins. The vertical red line represents the infall time of the galaxy into its z = 0 host, which occurred 6.1 Gyr ago.
Current usage metrics show cumulative count of Article Views (full-text article views including HTML views, PDF and ePub downloads, according to the available data) and Abstracts Views on Vision4Press platform.
Data correspond to usage on the plateform after 2015. The current usage metrics is available 48-96 hours after online publication and is updated daily on week days.
Initial download of the metrics may take a while.