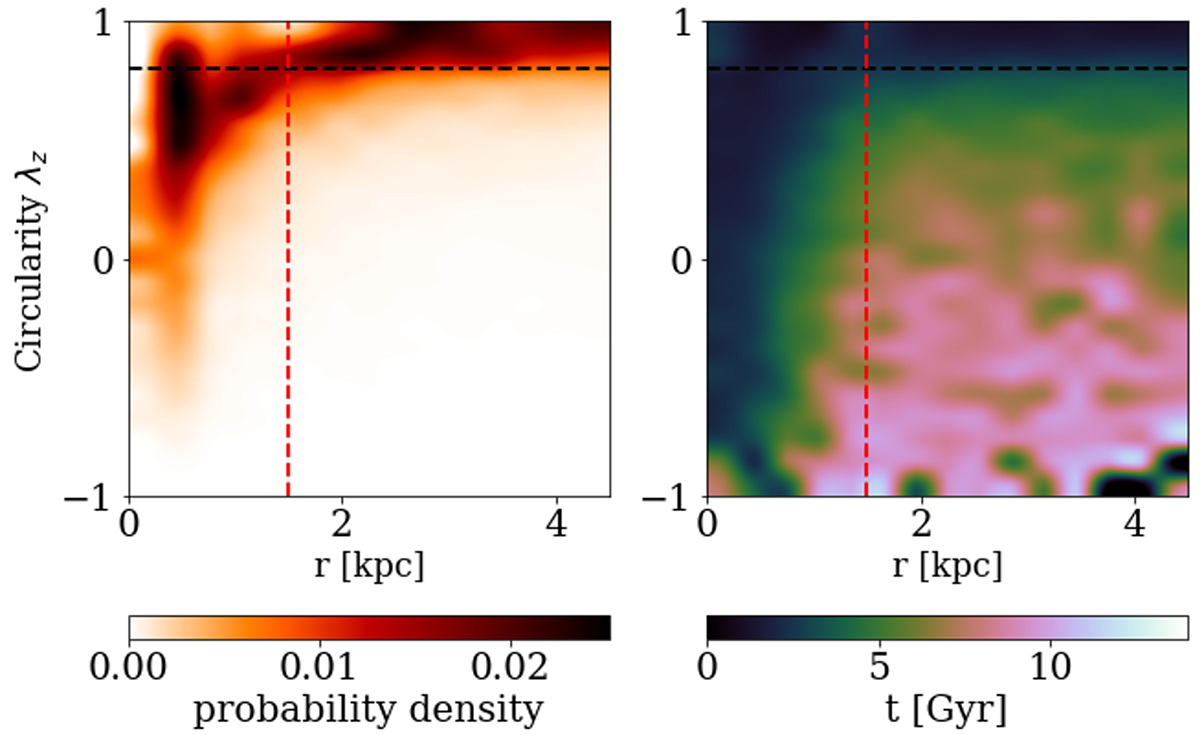
Fig. 2.
Download original image
Orbital decomposition of a typical TNG50 galaxy. We show the probability density distribution, p(r, λz) (left panel), and age distribution, p(r, t) (right panel) of the stellar orbits in the phase space of radius r versus circularity λz. The probability densities are normalized to unity within 3 Re. The dashed black line marks our division into two stellar components: a dynamically cold disk component (λz ≥ 0.8) and a dynamically hot non-disk component (λz < 0.8). The dashed red line represents the effective radius, Re, of this galaxy.
Current usage metrics show cumulative count of Article Views (full-text article views including HTML views, PDF and ePub downloads, according to the available data) and Abstracts Views on Vision4Press platform.
Data correspond to usage on the plateform after 2015. The current usage metrics is available 48-96 hours after online publication and is updated daily on week days.
Initial download of the metrics may take a while.