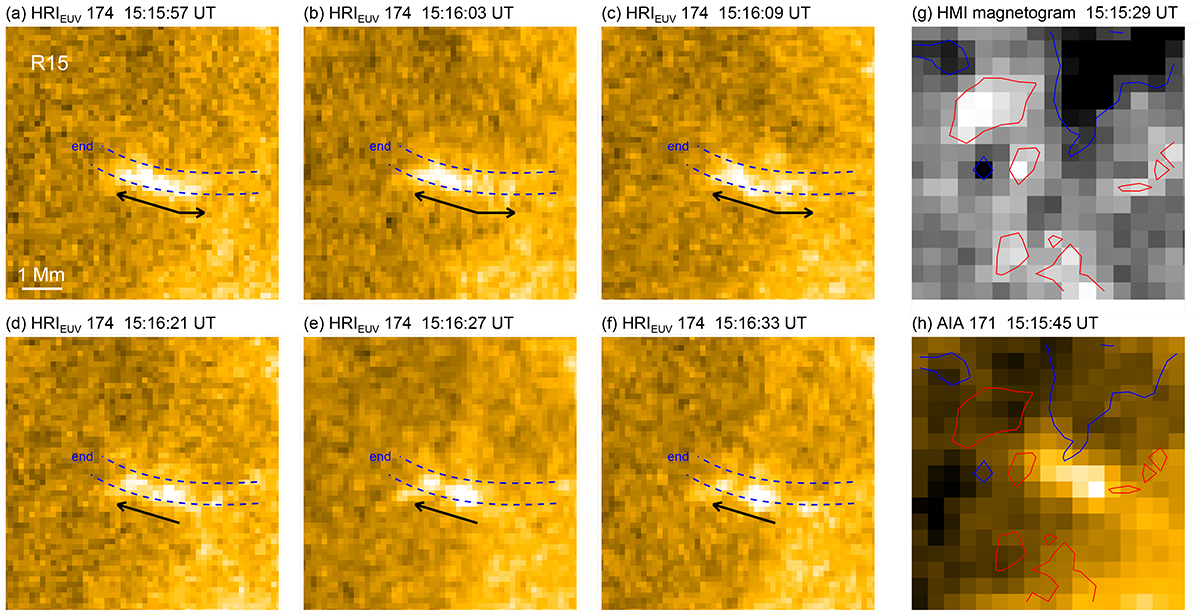
Fig. 5.
Download original image
(a)–(f) Temporal evolution of the R15 jets. The black arrows indicate the propagation directions of the jets. (g) HMI LOS magnetogram. The red and blue contours represent magnetic field strengths with levels of ±10 G, respectively. (h) AIA 171 Å map with overplotted HMI contours.
Current usage metrics show cumulative count of Article Views (full-text article views including HTML views, PDF and ePub downloads, according to the available data) and Abstracts Views on Vision4Press platform.
Data correspond to usage on the plateform after 2015. The current usage metrics is available 48-96 hours after online publication and is updated daily on week days.
Initial download of the metrics may take a while.