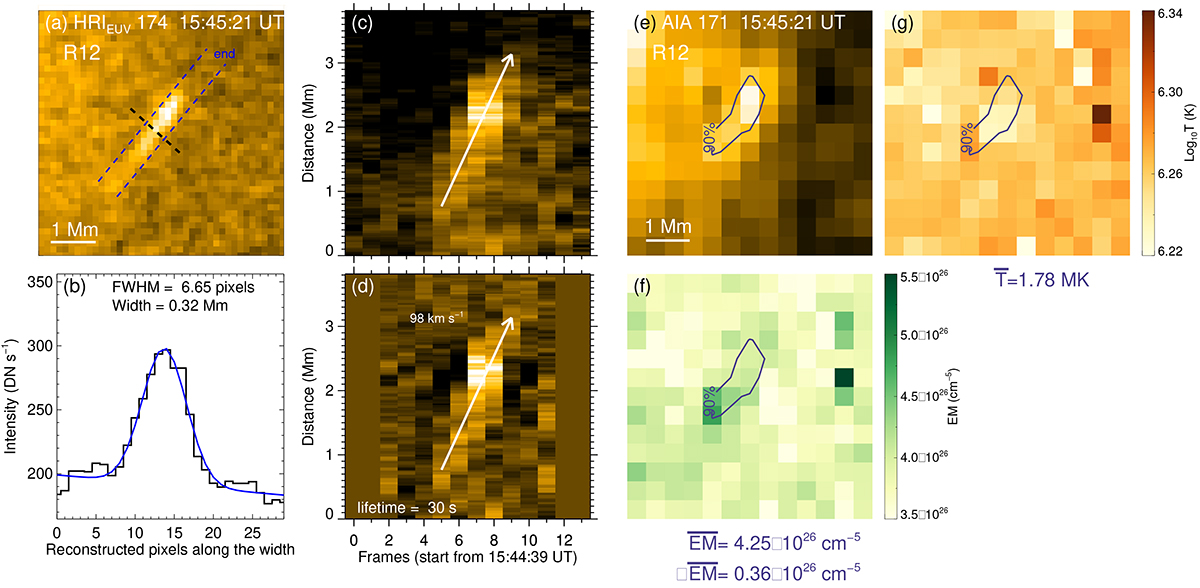
Fig. 3.
Download original image
(a) HRIEUV 174 Å image of the R12 jet. (b) The estimation of the jet width. (c) Time-distance diagram in the position of the blue slit. (d) Smooth-subtracted image of panel c. (e) AIA 171 Å image of the R12 jet. The contour level represents 90% of the peak intensity of AIA 171 Å. (f) The EM map. (g) The EM-weighted temperature map. The mean EM and temperature are averaged over the 90% area. ΔEM is the net increase in EM relative to the pre-jet value.
Current usage metrics show cumulative count of Article Views (full-text article views including HTML views, PDF and ePub downloads, according to the available data) and Abstracts Views on Vision4Press platform.
Data correspond to usage on the plateform after 2015. The current usage metrics is available 48-96 hours after online publication and is updated daily on week days.
Initial download of the metrics may take a while.