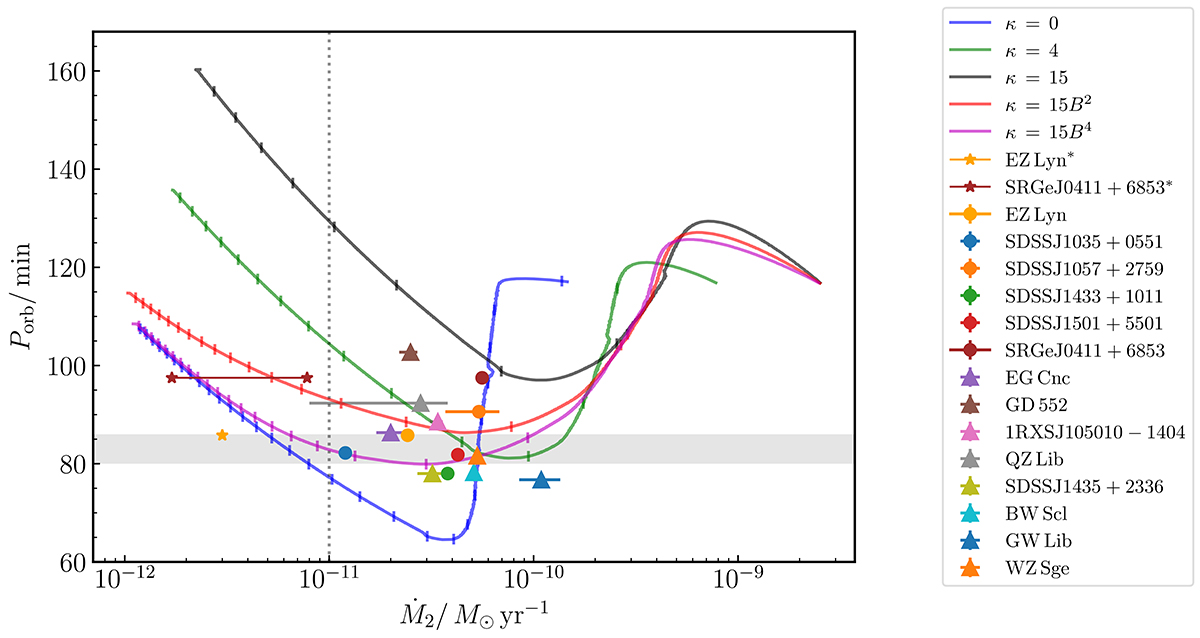
Fig. C.1.
Download original image
Evolution of CVs below the period gap. Solid lines show evolution in the Ṁ2 − Porb plane for the same tracks as in Fig. 1. Ticks on each track denote timesteps of 300 Myr. The dotted vertical line denotes Ṁ2 = 10−11 M⊙ yr−1. During further evolution, the system is presumably undetectable (see text). Observed period bouncer candidates from Table B.1 are also plotted. Eclipsing systems are plotted as circles, while non-eclipsing systems are plotted as triangles. The systems labelled and marked with stars have their Ṁ2 derived from X-ray luminosity (Eq. (C.2)), while the others have Ṁ2 derived from WD properties (Eq. (C.1)). The horizontal shaded region is the observed period minimum spike (80 ≲ Porb/min ≲ 86) reported by Gänsicke et al. (2009).
Current usage metrics show cumulative count of Article Views (full-text article views including HTML views, PDF and ePub downloads, according to the available data) and Abstracts Views on Vision4Press platform.
Data correspond to usage on the plateform after 2015. The current usage metrics is available 48-96 hours after online publication and is updated daily on week days.
Initial download of the metrics may take a while.